
This piece is the front portion of Chapter 20 (1) of The Declaration of the Age of Physical Economics (Yoon Jong-won, Yoon So-ri, Yoon Jun). It is an academic exposition presenting the authors' physical economics hypothesis, and the body, figures, and citations follow the manuscript as written.
The Additional Question Posed by 339 Months
The result of measuring America's macro data every month with the same diagnostic engine over the 339 months from January 1998 to March 2026 was placed alongside Korea's 351 months. When the verification periods of the two countries are combined, they amount to 690 months, about 57.5 years. In the previous chapter, Korea's 351 months verified six theoretical propositions. Automatic classification of crisis types, the independence of microcalcification and inflation, the ordering of the Five-Stage Collapse Pathway Law (DTDMC), the multiplicative structure of signal blockade (CAM) and channel blockade (DLT), the effect of the microvasculature direct-injection prescription, and the correspondence between the duration of blockade and the depth of the structure: these six propositions were demonstrated within the time series of a single country.
The fact that six propositions were verified in one country is powerful, but if that verification is confined to one country, doubt remains about the theory's universality. If variables such as the specificity of the Korean economy, that is, the foreign exchange crisis experience of the late 1990s, the excess of household credit in the early 2000s, and the export-dependent economic structure, are what determined the output of the diagnostic engine, then that engine is a Korea-only tool and not a universal one. If the theory is universal, the same engine must work on the data of other countries as well. America's 339 months become the material for verifying that universality.
The propositions that America's 339 months additionally demonstrate number four. First, the universality proposition that the same engine works in other countries as well. The fact that the same structure of 9 axes and 59 gauges and the same judgment algorithm recorded, in America's 339 months, the same accuracy as Korea, namely 0 false positives and 0 false negatives, is verified. Second, the proposition that the national specificity of gauge composition and the universality of the theory are compatible. The fact that the V13 gauge added for the United States (household Debt Service Ratio, DSR) and the V14 gauge (federal interest / GDP ratio) are derived from the same human-body-economy 1:1 mapping principle is demonstrated as core signals of the U.S. GFC.
Third, the proposition of the value of stand-alone satellite verification. The fact that, in the 2001 dot-com bubble, the blockade diagnosis reached only the warning threshold but satellite nighttime-light data independently caught a decline of about 20.4% in 2003 relative to the 2000 peak demonstrates the effectiveness of the triple-diagnosis design. It is a direct case in which a design where one diagnostic tool is supplemented by another when it hits its limit actually worked in the data. Fourth, the present-day diagnosis of 2025, that of simultaneous peak vulnerability in both countries. The period in which Korea and the United States simultaneously recorded their all-time V-Series highs is the first such occasion within the 690 months of verification, and the fact that the two countries had different kinds of vulnerability yet arrived at the same diagnosis shows another clue to universality.
When the verification results of America's 339 months are laid out in a table, a structure parallel to Korea's 351 months emerges. The incidence rate of dual blockade is nearly identical at 2.0% (7/351) for Korea and 2.1% (7/339) for the United States. Crisis detection differs, at 4 cases for Korea and 2 cases for the United States, but both countries recorded 0 false positives and 0 false negatives, and recovery detection was 100% in both countries as well. The cases of self-recovery from single blockade were also 3 each in both countries. The result that the same engine produced the same pattern of output in the two countries suggests not the chance hit of a single tool but the operation of a universal principle.
Overall Summary of America's 339-Month Verification
| Item | United States 339 Months (1998.1 to 2026.3) |
|---|---|
| Verification period | January 1998 to March 2026 |
| Dual blockade occurrence | 7 months / 339 months (2.1%) |
| Crisis detection | 2 cases (GFC, COVID-19) |
| DTDMC pathway match | 2/2 (100%) |
| False positives | 0 |
| False negatives | 0 |
| Lead detection | GFC about 6 months / COVID same month (macro crisis design scope) |
| Recovery detection | 2/2 (100%) |
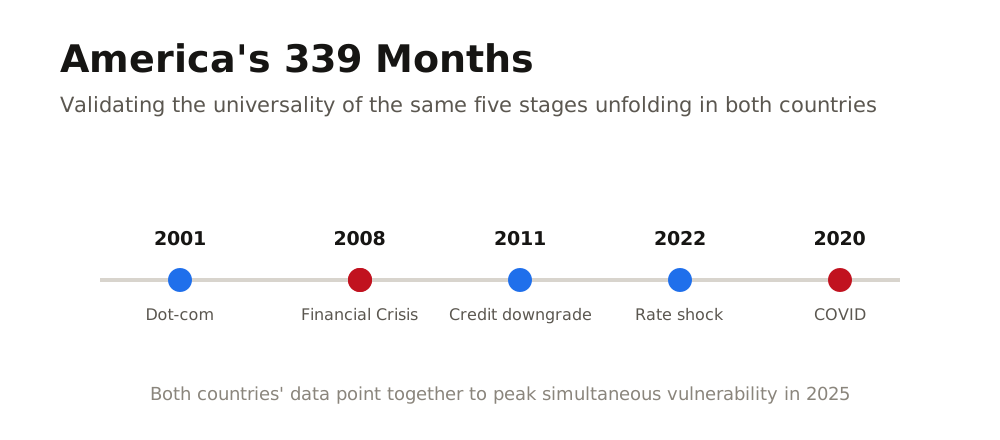
| Single-blockade self-recovery | 3 cases (2001 dot-com, 2011 credit rating downgrade, 2022 rate shock) |
| Number of V-Series gauges | 11 (Korea's 9 + V13 DSR + V14 federal interest/GDP) |
When the verification results of Korea and the United States are laid out in a parallel structure for the two countries, the fact that the track records of the two countries follow the same pattern is confirmed within a single table. The fact that over 690 months both countries were measured by the same engine, and that those measurements recorded the same accuracy, becomes primary evidence for the universality proposition.
Parallel Comparison of Korea's 351 Months and America's 339 Months
| Item | Korea 351 Months | United States 339 Months | Parallelism |
|---|---|---|---|
| Verification period | 1997.1 to 2026.3 | 1998.1 to 2026.3 | Nearly identical (29 years) |
| Dual blockade rate | 2.0% (7/351) | 2.1% (7/339) | Nearly identical |
| Crisis detection | 4 cases (IMF, card, GFC, COVID) | 2 cases (GFC, COVID) | 2 cases common to both |
| False positives | 0 | 0 | Identical |
| False negatives | 0 | 0 | Identical |
| Recovery detection | 2/2 (100%) | 2/2 (100%) | Identical |
| Single-blockade recovery | 3 cases (2001, 2011, 2022) | 3 cases (2001, 2011, 2022) | Same periods in both countries |
| V-Series gauges | 9 | 11 (V13, V14 added) | 9 common + 2 U.S.-specific |
| 2025 V-Series grade | All-time high | All-time high | Simultaneous peak in both countries |
This parallelism is the first sign pointing to the theory's universality. The fact that the same engine detected dual blockade at nearly identical rates in the two countries, the fact that single-blockade self-recovery in both countries occurred in exactly the same three periods (2001, 2011, 2022), and the fact that in 2025 both countries simultaneously reached their all-time V-Series highs are direct evidence of parallelism. In the sections that follow, we lay out step by step what this parallelism is composed of, tracing the process by which the four propositions additionally demonstrated by the United States are added to the six propositions verified in Korea.
The 2008 Global Financial Crisis in America, the Proposition That the Same Five Stages Proceed in Both Countries
The best material for verifying whether the same five-stage collapse pathway proceeds in the same order in two countries is the global financial crisis. The global financial crisis was a crisis that ignited in the United States and was transmitted around the world, and the igniting country, the United States, and the receiving country, Korea, experienced the shock at different positions within the same event. Whether, when the same engine is applied to the data of the two countries, the same five stages are traced in the same order is the object of verification in this section.
When one follows the 14-month time series of the U.S. GFC, a structure parallel to Korea's 14-month time series emerges. The temporal order of the first trigger (fundamental), the second trigger (lifestyle habit), and the third trigger (acute event) operated identically, the order of progression of the five stages (factor, onset, blockade, manifestation, recovery) was also identical, and the cases of stage reversal were 0 in both countries. However, because the United States was the igniting country, some events occurred earlier than in Korea, and the scale of the policy response was also far larger for the United States. Although the temporal order within the same stage and the scale of policy differed, the overall order of the five stages operated identically in both countries.
The factor stage accumulated in the United States over 2005 to 2007. The household Debt Service Ratio (DSR) reached its peak at 13.0% in 2005 and 13.2% in 2006, the house-price-to-income ratio (V4) rose to as much as 5.1 times in 2006, and the personal savings rate fell to 2.6% in 2005 and then remained at a low level of 2.8% again in 2007. During the same period, microcalcification was piling up thickly in the microvasculature of American households, and the emergency vault (savings) was nearly emptying out. It was the stage in which the first trigger of the funnel theory was being filled, and the subprime mortgage issuance practice corresponded to the second trigger. This accumulation was proceeding in parallel in Korea as well, and it temporally overlaps with the period when Korea's Gini coefficient was rising to 0.340.
The first event of the onset stage was in June 2007. Two hedge funds under Bear Stearns went bankrupt due to subprime mortgage defaults, and an event in which the emergency vault first shook in the American financial sector occurred. On August 9, 2007, BNP Paribas suspended redemptions on three asset-backed securities funds, and trust in the short-term funding market began to collapse. This is the point at which the third trigger of the funnel theory, that is, the acute event, ignited. These two events sent the same signal to the diagnostic engines of both Korea and the United States, and both countries entered the onset stage.
Entry into the blockade stage began in March 2008. On the 16th of the same month, Bear Stearns was announced to be sold to JPMorgan Chase at 2 dollars per share, and in U.S. data the blockade diagnosis broke through the warning threshold for the first time. It was the first month in which abnormal signals were detected simultaneously across multiple axes, and the I (cost explosion) and A (price surge) triggers were in an activated state. In April, the signal of the blockade diagnosis entered the alert stage, simultaneous warnings occurred across many of the 9 axes, and signal blockade (CAM) ignited. From May to August the blockade state was maintained, with a temporary easing in July, and after re-igniting in August, dual blockade was established together with Lehman Brothers' bankruptcy filing on September 15.
The manifestation stage began in earnest from September 2008. 1M (acute infarction, lung heat) appeared first in the capital market. Immediately after the Lehman bankruptcy in September, the S&P 500 plunged, and a credit freeze in which short-term funding transactions in the credit market were effectively halted occurred. On October 3, the Troubled Asset Relief Program (TARP) was approved by Congress, and funds on the scale of 700 billion dollars were injected into capital replenishment of financial institutions. On November 10, American International Group (AIG) received a bailout package on a cumulative scale of 150 billion dollars, and the automobile industry also began to collapse at the same time. In December, the signal of entry into the crisis stage reached its peak, the Federal Reserve lowered the benchmark interest rate to a level close to 0%, and on the 1st of the same month the National Bureau of Economic Research (NBER) officially declared a U.S. recession.
At the same time, 6M (supply chain disconnection) and 2M (economic slowdown) also proceeded. The collapse of the automobile industry created industrial disconnection centered on Detroit, in November GM and Chrysler requested government support, and in December the Bush administration approved 17.4 billion dollars in emergency automobile industry loans. As U.S. imports plunged in the global supply chain, the exports of Korea, Japan, and Germany collapsed simultaneously. The reason Korea experienced an 18% decline in exports during the same period was the direct result of the U.S. 6M manifestation. 3M (policy non-response, exhaustion) also appeared together. Despite the Federal Reserve's cumulative 525bp rate cut (from September 2007 to December 2008), the credit market did not loosen, and funds stayed within financial institutions and failed to reach households and businesses.
The turning point of the recovery stage was February 2009. On the 17th of the same month, the Obama administration signed the American Recovery and Reinvestment Act (ARRA) of 787 billion dollars, and funds began to reach households and local governments directly for the first time. Jobs programs, infrastructure investment, state government fiscal support, and direct household support were included in the package. In the same month, in Korea too a supplementary budget of 28.4 trillion won began to reach households, and in both countries the microvasculature direct injection worked simultaneously. On March 9, the S&P 500 hit its absolute low of 676.53, and in April the U.S. dual blockade was lifted. This is a point 2 months ahead of the NBER's official declaration of the end of the recession (June 2009).
GFC U.S. 14-Month DTDMC Five-Stage Time Series (Parallel to Korea's 14 Months)
| Month | DTDMC Stage | Stage Signal | U.S. Policy / Event |
|---|---|---|---|
| 2007-06 | Onset (outflow begins) | Below blockade threshold | Two hedge funds under Bear Stearns go bankrupt |
| 2007-08 | Onset (third trigger) | Below blockade threshold | 8.9 BNP Paribas suspends redemptions on asset-backed securities funds |
| 2008-03 | Blockade imminent | Warning threshold broken, multiple axes warn | 3.16 Bear Stearns sold to JPMorgan at $2 per share |
| 2008-04 | Blockade entry | Alert stage, CAM ignites | Government "impact limited". Pressure on U.S. households becomes visible |
| 2008-07 | Single blockade temporarily eased | Caution stage, CAM lifted | Oil price reverses after $147 peak |
| 2008-08 | Blockade re-ignites | Alert stage, CAM re-ignites | U.S. housing defaults spread in earnest |
| 2008-09 | Dual blockade established | Crisis stage, CAM+DLT simultaneous | 9.15 Lehman Brothers files for bankruptcy |
| 2008-10 | Manifestation (1M acute infarction) | Crisis stage maintained | 10.3 TARP $700 billion approved by Congress |
| 2008-11 | Manifestation (6M disconnection) | Crisis stage maintained | 11.10 AIG cumulative $150 billion bailout package. GM, Chrysler request support |
| 2008-12 | Manifestation peak (3M exhaustion) | Crisis stage peak | NBER declares recession. Fed cuts benchmark rate to 0%. 12.19 automobile $17.4 billion support |
| 2009-02 | Recovery entry | Crisis signal maintained | 2.17 ARRA $787 billion signed. Direct reach to households and local governments begins |
| 2009-03 | Recovery in progress | Crisis signal weakens | 3.9 S&P 500 absolute low 676.53 |
| 2009-04 | Blockade lifted | Return to normal stage | Dual blockade lifted. 2 months ahead of NBER end declaration (June) |
When this 14-month time series is placed side by side with Korea's 14 months (Table 19-5), it is confirmed that the order of progression of the five stages was completely identical in the two countries. In both countries the June 2007 bankruptcy of Bear Stearns hedge funds was the first event of the onset stage, the August 2007 BNP Paribas redemption suspension was the third trigger, and the March 2008 sale of Bear Stearns was the signal of imminent blockade. In both countries CAM blockade ignited in April 2008, there was a temporary easing in July, and dual blockade was established together with the Lehman bankruptcy on September 15. In both countries large-scale fiscal support began to reach households in February 2009, blockade was lifted in April, and this came 2 months ahead of the NBER's official end declaration.
The scale of policy funds differed between the two countries. While the United States injected 787 billion dollars in ARRA, Korea injected 28.4 trillion won, and when converted to scale relative to each country's GDP, it was about 5.5% for the United States and about 2.7% for Korea. However, the way the funds reached, that is, the microvasculature injection method of reaching households and local governments directly, was identical in the two countries. The absolute scale of the policy funds differed, but the result that once those funds reached the microvasculature, blockade was lifted within 1 to 2 months in both countries, was the same. The fact that the same prescription principle produced the same effect in the two countries shows that the microvasculature direct-injection prescription proposition verified in Section 9 is not a result confined to Korea.
The fact that the order of the five stages, the temporal structure of the third trigger, and the result of 0 stage reversals operated identically in the two countries is the direct verification of Proposition 7, that is, the universality proposition that the same engine works in other countries as well. The conclusion that the theory is not a tool tailored to the specificity of one country but rather captures the physical structure of crisis in general is derived from the alignment of the two time series.
The Weight of V13 DSR at 13.2%, the Microcalcification Measured by a U.S.-Specific Gauge
America's V-Series is composed of 11 gauges. Whereas Korea's V-Series has 9, two are added, V13 (household Debt Service Ratio, DSR) and V14 (federal interest / GDP ratio). The reason these gauges, though derived from the same human-body-economy 1:1 mapping principle, are absent in Korea but present in the United States, and how these two gauges caught the U.S. GFC more deeply than other gauges, is the object of verification in this section.
What V13 DSR measures is the proportion of a household's disposable income that flows out each month for the repayment of debt principal and interest. In the United States, the period in which this ratio stayed near its peak at 13.0% in 2005, 13.2% in 2006, and 12.8% in 2007 was just before the GFC. It means that a state in which about one-eighth of household disposable income flowed out each month for debt repayment persisted for more than two years, and it points to the fact that microcalcification was deposited most thickly in the microvasculature of American households during this period. Transposed to the human body, it corresponds to a state in which 13% of the cross-sectional area of the coronary artery is narrowed by calcium deposition, a critical stage at which blood flow cannot pass through when an additional shock comes in.
The reason V13 is absent from Korea's V-Series is that the household debt structures of Korea and the United States differ. In Korea, an informal debt structure such as the jeonse system is common, so it is difficult to sufficiently capture the household debt burden with the single indicator of DSR. In Korea, other gauges such as the jeonse-price ratio (V4) and the outstanding household credit balance measure the same microcalcification accumulation. It is the result of measuring the same body part (the coronary artery) but composing the measurement method differently to reflect the institutional differences of the two countries. The human-body-economy 1:1 mapping principle is the same, but the gauge in which that mapping is implemented reflects the institutional specificity of the country.
The V14 federal interest / GDP ratio measures what percentage of GDP a country's government spends each year on government bond interest payments. In the United States, this ratio rose to 3.2% in 2025, a state close to the risk threshold of 3.5%. It is a level at which about 16 to 18 out of every 100 won of taxes the government collected disappears into interest payments, and it points to the fact that the fiscal room to respond to new shocks has shrunk correspondingly. Transposed to the human body, it is a stage in which calcium is deposited on the aorta itself and the government's fiscal oxygen is exhausted by interest payments. The reason V14 is absent from Korea's V-Series is that Korea's national debt / GDP is low, at about 1/3 the level of the United States, so the V14 gauge does not reach the activation threshold, and the reason V14 was added for the United States is that U.S. federal debt exceeds 120% of GDP, so the V14 signal became a core variable of the diagnosis after the GFC.
Comparison of Korea's 9-Gauge V-Series and America's 11-Gauge V-Series
| Gauge | DIAH | Measurement Target | Korea | United States | Meaning of the Difference |
|---|---|---|---|---|---|
| V1 working-age population growth rate | vulnD | Change in cell count | ○ | ○ | Common to both: population is the foundation of every economy |
| V7 current account / GDP | vulnD | Blood outflow outside the body | ○ | ○ | Common to both: external sector flow |
| V4 house-price / income ratio | vulnI | Latent microcalcification | ○ | ○ | Common to both: measuring asset bubbles |
| V9 Gini coefficient | vulnI | Division of the circulation path | ○ | ○ | Common to both: core of income polarization |
| V10 bottom income growth rate | vulnI | Vitality of peripheral cells | ○ | ○ | Common to both: measuring vulnerable groups |
| V13 household Debt Service Ratio (DSR) | vulnI | Peak of household microcalcification | × | ○ | U.S.-specific: household debt burden measured directly |
| V5 real private consumption | vulnH | Oxygen supply | ○ | ○ | Common to both |
| V6 savings rate / average propensity to consume | vulnH | Remaining balance of the emergency vault | ○ | ○ | Common to both: only the unit of measurement differs |
| V11 service sector employment / production | vulnH | Microvasculature blood flow | ○ | ○ | Common to both |
| V12 domestic demand contribution (PCE) | vulnH | Share of biological circulation | ○ | ○ | Common to both |
| V14 federal interest / GDP | vulnH | Calcification of the aorta | × | ○ | U.S.-specific: activated by the scale of federal debt |
When the V-Series time series of the 5 years just before the U.S. GFC is laid out, it emerges that the only period in which the three gauges V13 DSR, V4 house-price / income ratio, and V6 savings rate all entered the severe stage simultaneously was 2006. During the same period, V7 current account / GDP was at -5.8%, when the chronic deficit was deepest, and V9 Gini coefficient was at 0.470, when the fracture in income distribution was at its peak. The fact that five gauges sent risk signals simultaneously points not to the chance fluctuation of a single gauge but to the entire structure collapsing in the same direction.
U.S. GFC 2007 Pre-Crisis V-Series Structural Diagnosis, 5-Year Accumulation
| V-Series Gauge | 2005 | 2006 (peak) | 2007 | 2008 (crisis) | 2009 (trough) | Stage |
|---|---|---|---|---|---|---|
| V13 DSR | 13.0% | 13.2% (peak) | 12.8% | 12.0% | 10.8% | Severe (2005, 2006), caution (2007) |
| V4 house-price / income | 4.6 times | 5.1 times (peak) | 4.8 times | 3.9 times | 3.2 times | Severe (2006) |
| V6 savings rate | 2.6% | 3.4% | 2.8% | 5.0% | 6.1% | Severe (2005, 2007) |
| V9 Gini coefficient | 0.469 | 0.470 | 0.463 | 0.466 | 0.468 | Entrenched severe |
| V7 current account / GDP | -5.7% | -5.8% | -4.9% | -4.6% | -2.7% | Chronic deficit (below -3%) |
The weight of the fact that V13 DSR peaked at 13.2% in 2006 emerges in this time series. Since Korea's V-Series has no DSR, the same kind of accumulation was measured by other gauges (jeonse-price ratio, outstanding household credit balance), but the measurement result was in the same direction. In both countries, the microcalcification accumulation in the household microvasculature reached its peak just before the GFC, and in both countries the external shock was met at that peak. The fact that measuring the same accumulation with different gauges arrived at the same crisis diagnosis is the direct verification of Proposition 8, that the national specificity of gauges is compatible with the universality of the theory.
The same principle operates in V14 federal interest / GDP as well. The V14 gauge, which has not reached the activation threshold in Korea, became a core variable of the diagnosis after the GFC in the United States, and in 2025 rose to 3.2%, entering the stage of approaching the risk threshold. The institutional difference that Korea's government debt / GDP is at about 1/3 the level of the United States is reflected in gauge activation, and this is the result not of the gauge being absent but of the measurement target not yet having reached the threshold. The structure in which the diagnostic engines of the two countries share the same pool of candidate gauges while operating different active gauges according to each country's actual measured situation is the actual operation of Proposition 8.