
This piece is the complete Chapter 22 of The Declaration of the Age of Physical Economics (Yoon Jong-won, Yoon So-ri, Yoon Jun). It is an academic exposition presenting the authors' physical economics hypothesis, and the body, figures, and citations follow the manuscript as written.
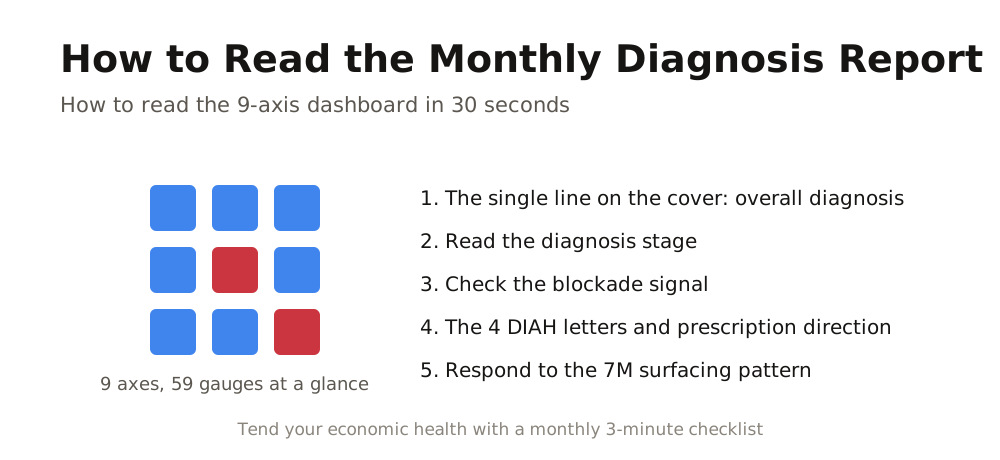
On the first day of every month, the diagnostic system prints out a single report. It is a PDF of about 30 pages, published as one copy each for two countries, the United States and Korea, and it keeps the same format every month. This report is the output of the world's first physical-flow-based triple diagnostic system, and the reason this report is the world's first is that it integrates government statistics and satellite measurement into a single report.
The report is 30 pages thick and has more than 10 tables, so it is hard to read all the way through in one sitting. That is why a manual is needed. The manual guides 2 things: first, where to look first, and second, what signal it is that, when you see something, tells you what to check. The purpose of this chapter is to lay out those 2 guides in one place, and the promise of this manual is to help the reader who receives the monthly report grasp the essentials within 3 minutes and go over the whole thing within 30 minutes.
At the end of this chapter, one copy of the April 2026 U.S. report is attached as a short appendix. This appendix becomes an old document once a month has passed, but the manual itself remains valid as it is, as long as a report in the same format is printed every month. That is why the body of this chapter is filled with how-to instructions, and the April U.S. case is gathered in the single place of the appendix.
The order in which you open the first page: what to read first from the single line on the cover
The page that the reader who has received the report opens first is the cover, and within the single line on the cover, all the diagnostic essentials of that month are contained. This single line is composed of 6 information units. First is the data reference month and the report preparation date, second is the overall assessment stage, third is the signal blockade (CAM) status, fourth is the channel blockade (DLT) status, fifth is whether the dual blockade (CAM-DLT) is active, and sixth is the activated DIAH trigger.
What the reader must grasp within 30 seconds of opening the single line on the cover is 4 of those 6 units. Those 4 are the overall assessment stage, whether the dual blockade is active, the active DIAH trigger, and the data reference month. Whether the overall stage is stable or is in caution or beyond is the first fork, and if the dual blockade is active, you must open the blockade diagnosis page before any other page. Which of the letters written on the cover (D, I, A, H) the active DIAH trigger is, is the core information that divides the direction of that month's prescription, and the data reference month is the clue for checking whether some indicators came in a month late due to a delay in the previous month's release.
If we transpose the single line on the cover into a human-body diagnosis, it corresponds to the first line of the first-round opinion note that a doctor writes right after examining a patient. The statement that there is no blockage in the large artery (signal blockade normal), no blockage in the microvasculature either (channel blockade normal), and therefore this is not an acute crisis stage, is the meaning of the 3 units of signal blockade, channel blockade, and dual blockade. However, which of the 4 blood-test items is out of the normal range is the meaning of the single letter of the DIAH trigger, and the overall stage is the comprehensive health stage of that one patient. If you grasp this single line within 30 seconds, it is decided from where you should open that month's report.
How to interpret the diagnostic stages: stable, caution, alert, crisis, critical
Every stage that the diagnostic system prints out is set on a 5-level scale. Those 5 levels are stable, caution, alert, crisis, and critical, and the meaning of each is not identical. What is most often misunderstood is the meaning of the stable stage, but the stable stage does not mean healthy; it merely means that the risk threshold has not yet been reached. It is the same as the way, in a human health checkup, a result showing blood pressure within the normal range does not mean the patient is healthy but means the blood pressure has not reached the danger threshold.
If we organize the interpretation method of the 5 levels into a table, then when the reader receives the report, what must be checked at each stage comes into view at a glance.
The meaning of the 5 diagnostic stages and reader action by stage
| Stage | One-line meaning | Human-body analogy | Reader action |
|---|---|---|---|
| Stable | Threshold not reached | Body temperature and blood pressure normal | Monthly check only |
| Caution | Accumulation of structural weakening | Liver values slightly elevated | Track the cause gauge |
| Alert | Surfacing of the signal stage imminent | Vascular calcification progressing | Check the blockade signal |
| Crisis | Blockade ignition or the start of surfacing | Symptoms just before a stroke | Review immediate prescription |
| Critical | Dual blockade + simultaneous multi-axis crisis | Cardiac arrest in progress | Trigger emergency response |
There is one more thing to note in stage interpretation. More important than the fact itself that one axis was printed out as the caution stage is the signal of in which direction that axis moved compared with the previous month. If it entered caution from stable, it is a stage in which new weakening has begun and you must trace the cause, but if it returned to stable from caution, it is a recovery stage and you must trace what the policy was that drew out that recovery. The fact that a stage itself is not a static score but a single position in a dynamic flow is the second promise of this manual.
How to read the 9-axis dashboard within 30 seconds
The page that unfolds after the cover is the 9-axis dashboard, and it is the single page with the highest information density in the report. On this page, the state of 9 organ systems is organized at a glance, and the 9 axes correspond one-to-one to the 9 organ systems of the human body. If you learn in advance the naming of the 9 axes and their human-body correspondences, you can read an entire page within 30 seconds.
The naming of the 9 axes and their correspondence to human organ systems
| Axis | Name | Human-body part | Gauges | Economic domain |
|---|---|---|---|---|
| A1 | Circulatory system | Heart and blood vessels | 8 | Financial market capital circulation |
| A2 | Respiratory system | Lungs and airways | 5 | Trade and dollar flow |
| A3 | Digestive system | Stomach and intestines | 5 | Consumption and credit flow |
| A4 | Nervous system | Brain and nerves | 4 | Policy and market signals |
| A5 | Immune system | Blood quality and lymph | 10 | Financial stability and fiscal defense |
| A6 | Endocrine system | Hormones and thyroid | 8 | Prices and currency value |
| A7 | Musculoskeletal system | Muscles and bones | 6 | Industry, manufacturing, and housing |
| A8 | Muscular system | Capillaries and extremities | 10 | Employment and household debt |
| A9 | Regenerative system | Regeneration and growth | 3 | Growth, capital, and corporate debt |
The procedure for reading the 9-axis dashboard within 30 seconds is organized into 3 steps. First, count the number of axes among the 9 that are at the caution stage or beyond. If it is 0, then that month all structural-weakening signals are in a latent state; if it is 1 to 2, it is partial weakening; and if it is 3 or more, it becomes a place of simultaneous multi-axis weakening where a broad check is needed. Second, confirm at which position the caution-or-beyond axes are. The immune system (A5) and the endocrine system (A6) are the positions that hold up the stability of the system overall, so when a caution signal comes out on these two axes, they become the priority targets for checking ahead of all other axes. Third, confirm with the arrow next to the stage whether the caution-or-beyond axis is a position newly entered compared with the previous month, a position that is persisting, or a position that is recovering.
The reason 9 axes are unfolded simultaneously on one page is that a crisis almost never happens on only one axis. The Great Depression of 1929 was an event in which the 3 axes of the immune system, the muscular system, and the regenerative system collapsed simultaneously; the 2008 global financial crisis was an event in which the circulatory system, the immune system, and the muscular system entered in turn; and the 1997 Korean foreign-exchange crisis was an event in which the respiratory system, the immune system, and the endocrine system shook all at once. A crisis that is missed when looking at only one axis is caught by simultaneous multi-axis checking.
What to check when a blockade signal (CAM, DLT) appears
The page that unfolds after the dashboard is the blockade diagnosis. The blockade diagnosis prints out a different kind of information from structural weakening, and that information corresponds to an acute crisis signal. If structural weakening is the accumulation of a chronic disease, the blockade signal is the stage just before acute ignition. The event in which calcification accumulates in one patient's blood vessel is structural weakening, and the event in which a blood clot suddenly settles on top of that calcification and the vessel becomes blocked is blockade ignition.
There are 2 kinds of blockade, and the two have formal names according to the established doctrine. The first is signal blockade (CAM), and the second is channel blockade (DLT). Signal blockade is an event in which a signal flow such as income or currency is cut off, and channel blockade is an event in which the channel itself, such as consumption or logistics, is blocked. If only signal blockade is active, the system has the possibility of recovering on its own, and even if only channel blockade is active, there is room for recovery. However, if signal blockade and channel blockade are activated simultaneously and the dual blockade (CAM-DLT) is established, the system cannot recover on its own, and unless an external prescription is administered immediately, it enters the 7M surfacing stage. This multiplicative structure is the core proposition established in Part II of this book, and if we transpose it into a single line of the manual, it becomes the following table.
The 4 scenarios of the blockade signal and reader action
| CAM (signal blockade) | DLT (channel blockade) | Diagnosis | Reader action |
|---|---|---|---|
| Normal | Normal | No blockade | Check structural weakening only |
| Caution or alert | Normal | Signal flow slowing | Track income and currency signals |
| Normal | Caution or alert | Channel flow slowing | Track consumption and logistics channels |
| Caution or alert and beyond | Caution or alert and beyond | Dual blockade (CAM-DLT) | Crisis ignition: immediate response |
There is one more thing to note in the blockade diagnosis: the 2-consecutive-month condition. A blockade is not ignited by a single month's signal alone; the reason a blockade is printed out as formally active only when the same signal is caught for 2 consecutive months is to filter out the noise of a single data point. So when reading the blockade diagnosis, an attitude of looking at the blockade status in the report from one month ago together with this month's blockade status is needed, and if it was normal a month ago but changed to caution this month, the next month is the first candidate month for blockade ignition.
The 4 letters of the DIAH trigger: the prescription direction of each of D, I, A, H
The page that follows is the DIAH trigger analysis, and this single page determines the direction of that month's prescription. DIAH is an abbreviation of 4 letters, and each letter corresponds to one of the 4 pathological states that give rise to every economic crisis. D is Deficiency (income polarization), I is Inflammation (cost explosion), A is Acidosis (price surge), and H is Hypoxia (monetary sclerosis).
The key to reading the DIAH trigger is not which letter is active but which letter is not active. If only 1 of the 4 letters is active, you can concentrate the prescription on that one letter, but if 2 or more letters are active simultaneously, it is a place where mutual reinforcement has begun, and if all 4 letters are active, it is the precursor pattern of a Great-Depression-of-1929-type crisis. The attitude of first counting the number of DIAH letters written on the single line on the cover is the first move in reading this page.
The meaning of the 4 DIAH letters and the prescription direction
| Trigger | Economic meaning | Human-body analogy | Prescription direction |
|---|---|---|---|
| D | Deficiency, income polarization | Nutrition not reaching the extremities | Direct injection into the microvasculature and income transfers |
| I | Inflammation, cost explosion | Cost > income leads to chronic inflammation | Simultaneous easing of costs such as interest, taxes, and medical care |
| A | Acidosis, price surge | Erosion of currency value | Blocking the feedback of raw materials, supply chains, and exchange rates |
| H | Hypoxia, monetary sclerosis | Blockage of microvascular circulation | Direct delivery of funds bypassing the aorta |
To keep the prescription direction of Table 22-4 from sounding abstract, let us note one case. A period in which the H (Hypoxia) trigger is singly active is a period in which funds are sufficient in the aorta but do not reach the microvasculature, and in such a period, even if the central bank additionally lowers the policy interest rate, the funds do not reach the microvasculature. Korea's decision in April 2020 to directly transfer 11.7 trillion won of the first supplementary budget into household accounts is one model of an H-trigger prescription, and the U.S. decision in 2008 to inject 4.5 trillion dollars into the banking system through quantitative easing was a prescription in a different direction for the same H trigger. Even if the active trigger is the same, if the prescription path is different, the results diverge.
The 7M surfacing pattern: the response method at the manifestation stage
The page after the DIAH trigger is the 7M pattern analysis. 7M is the 7 collapse mechanisms by which the 4 pathological states of DIAH surface in the actual economy, and the fact that this stage has been printed out as active in the report is a signal that the crisis has already entered the manifestation stage. If the blockade is the stage just before ignition, 7M is the stage just after ignition, and the path by which one or more of the 7M are activated in the month following the activation of the dual blockade corresponds to the 4th stage of the Five-Stage Collapse Pathway Law (DTDMC) established in Part II of the book.
The 7 patterns of 7M surfacing and their human-body and economic correspondences
| Pattern | Name | Human-body symptom | Economic phenomenon |
|---|---|---|---|
| M1 | Credit crunch | Symptoms just before a brain hemorrhage | Sharp drop in corporate bond and commercial paper issuance |
| M2 | Chain of defaults | Chain of organ failure | Spread of a large-default domino |
| M3 | Dash for cash | Emergency room in shock | Simultaneous selling of stocks and bonds, concentration in safe assets |
| M4 | Surge in unemployment | Muscle atrophy | Mass layoffs and a surge in unemployment benefits |
| M5 | Contraction of consumption | Halted digestion | Sharp drop in retail sales and service revenues |
| M6 | Housing collapse | Bone fracture | Sharp drop in housing transaction volume and falling prices |
| M7 | External shock | Shock transmission | Currency plunge and foreign-capital outflow |
When a 7M pattern is printed out as active, the first thing the reader should check is from which blockade that pattern surfaced. M1 credit crunch and M3 dash for cash are the positions that surface from signal blockade (CAM), and M2 chain of defaults and M5 contraction of consumption are the positions that surface from channel blockade (DLT). M4 surge in unemployment and M6 housing collapse are late stages that surface when both blockades are active, and M7 external shock is a pattern that is separately activated by an external trigger. Which of the 7M patterns is active determines the timing of the prescription.
How to read the satellite diagnosis together with the statistics
One page of the report is separated out as the satellite diagnosis, and this page prints out a different kind of information from the statistics. Statistics are data that humans compile and report, and there is a time lag until release, whereas satellites are physical signals measured in real time from space, and they cannot be manipulated. 4 satellites are operated simultaneously, and each catches a different kind of signal.
The 4 satellites and their measured signals
| Satellite | Measured signal | Economic meaning | Lead over statistics |
|---|---|---|---|
| DMSP/OLS | Nighttime lights (low resolution) | Urban and industrial activity level | 2 to 3 months ahead |
| VIIRS | Nighttime lights (high resolution) | Urban vitality and consumption activity | Updated once a month, ahead of statistical release |
| Landsat | Surface temperature (heat island) | Industrial operation and heat-source distribution | Updated every 2 weeks, ahead of release |
| Sentinel-1 | Radar backscatter | Construction, logistics, and port activity | Updated every 6 days, ahead of quarterly statistics |
The way to read the satellite diagnosis together with the statistics splits into agreement and divergence. If the satellite signal and the government statistics point in the same direction, that signal is printed out as reinforcing confidence, and if they point in different directions, it becomes an immediate check target. The case in which Greece reported its 2009 fiscal deficit as 3.7% of GDP when the actual figure was 12.7% is the place that most vividly shows the necessity of the satellite diagnosis, and even when the statistics were manipulated, the nighttime lights, the surface temperature, and the radar signals did not hide the truth. That is where the reason lies that the satellite diagnosis functions as the verification layer of the statistical diagnosis.
There are also clear places where the satellite is faster than the statistics. While government statistics wait for a quarterly release, the nighttime-lights satellite catches changes in urban activity level 2 to 3 months earlier, and the radar satellite catches changes in construction and logistics activity at 6-day intervals. If, in the monthly report, the satellite signal changed the stage ahead of the statistics, it is interpreted as a leading signal that next month's statistics may follow in the same direction.
The 3-minute usage checklist when you receive the monthly report
If you check, once each, the 7 places noted so far (cover, stage, 9 axes, blockade, DIAH, 7M, satellite) every time you receive the monthly report, you can grasp the essentials within 3 minutes. The following checklist is that check order organized into one table.
The 3-minute usage checklist: the 6-step order
| Order | Object of confirmation | Judgment criterion + action |
|---|---|---|
| 1 | The single-line diagnosis on the cover | Confirm the stage (stable, caution, alert, crisis, critical) + blockade status |
| 2 | The 9-axis dashboard | Count the number of caution-or-beyond axes + whether there is simultaneous activation |
| 3 | The blockade signal | Whether CAM and DLT are single or dual + the 2-consecutive-month condition |
| 4 | The DIAH trigger | Active trigger among the 4 letters, then confirm the prescription direction in Table 22-4 |
| 5 | 7M surfacing | Active pattern, then confirm the economic phenomenon in Table 22-5 |
| 6 | The satellite diagnosis | Whether it agrees with or diverges from the statistics, then agreement reinforces confidence, divergence means an immediate check |
At a place where the decision is difficult even after going through all 6 steps of the checklist, open the clinical opinion paragraph written on the last page of the report. The clinical opinion is the part that compresses that month's most important finding into one paragraph in the tone of a doctor's diagnosis note, and it corresponds to the bridge between the single line on the cover and the 30-page body. If the cover is the 30-second diagnosis and the body is the 30-minute close reading, the clinical opinion is the conclusion of the 3-minute diagnosis and the single page you confirm last before closing the report.
The 7 places and the 3-minute checklist that this manual has guided remain valid as they are, as long as a report in the same format is printed every month. They work in the same way in the April 2026 U.S. report, in a December 2027 Korea report, and in some month's report for another country in 2030. The April U.S. sample unfolded in the next section becomes an old document once a month has passed, but this manual does not.
Appendix: A short example of the April 2026 U.S. report
Let us follow the 7 places of the manual with a single example. The single line on the cover of the April 2026 U.S. report was printed out as follows. The overall assessment stage was the caution stage, the signal blockade (CAM) was normal, the channel blockade (DLT) was normal, there was no dual blockade, and the DIAH active was only the single letter I. Among the 4 information units, the statement that there is no dual blockade is the stable signal at the first fork, and the page that the reader who saw the single line on the cover opened next was the 9-axis dashboard.
The one-line diagnosis of the 9-axis dashboard of the April 2026 U.S. report
| Axis | Human-body part | Stage | April U.S. one-line diagnosis |
|---|---|---|---|
| A1 | Circulatory system | Stable | Financial market circulation sound |
| A2 | Respiratory system | Stable | Trade and dollar flow sound |
| A3 | Digestive system | Caution | Slowing consumer confidence and a declining savings rate simultaneously |
| A4 | Nervous system | Stable | Smooth transmission of policy signals |
| A5 | Immune system | Caution | Cumulative weakening of the fiscal structure: the core axis of the April report |
| A6 | Endocrine system | Caution | CPI and Core PCE holding above the Fed's target |
| A7 | Musculoskeletal system | Stable | Industry, manufacturing, and housing sound |
| A8 | Muscular system | Stable | Unemployment rate, employment, and new claims sound |
| A9 | Regenerative system | Stable | Growth and capital formation sound |
Among the 9 axes, the number printed out as the caution stage was 3, and those 3 were the digestive system (A3), the immune system (A5), and the endocrine system (A6). It was simultaneous multi-axis caution, but the dual blockade was in an unignited state, and the position named as the most important system in the clinical opinion was the immune system. The statement that the immune system's caution originated from the cumulative weakening of the U.S. federal fiscal structure is the core finding of the April report, and because the blockade had not yet ignited, the prescription was printed out not as immediate response but as active monitoring. Because on the DIAH trigger page the active letter was only I, the prescription direction was concentrated on the single place of easing the inflammation of costs and interest.
What this appendix shows is how a report for a month in which the stage is close to stable is read. A report for a month in which the stage entered crisis was unfolded as an example in Part III, in Chapter 19 with Korea's April 2020 COVID case and in Chapter 20 with the U.S. September 2008 Lehman case. The reason the same manual applies to reports of 2 different stages is that the same format is maintained every month, and the promise of the manual stands on that consistency.
References
1. An, Z., Jalles, J. T., & Loungani, P. (2018). How Well Do Economists Forecast Recessions? IMF Working Paper, WP/18/39. doi:10.5089/9781484338643.001
2. Elvidge, C. D., Baugh, K. E., Zhizhin, M., Hsu, F.-C., & Ghosh, T. (2017). VIIRS Night-Time Lights. International Journal of Remote Sensing, 38(21), 5860-5879.
3. European Commission (2010). Report on Greek Government Deficit and Debt Statistics. COM(2010) 1, January 2010.
4. Federal Reserve Board (2026). Beige Book and Monetary Policy Report, April 2026.
5. Federal Reserve Bank of New York (2026). Quarterly Report on Household Debt and Credit, Q1 2026.
6. Bureau of Economic Analysis (2026). Personal Income and Outlays, March 2026.
7. Bureau of Labor Statistics (2026). Consumer Price Index, March 2026.
8. U.S. Department of the Treasury (2026). Monthly Treasury Statement, April 2026.
9. European Space Agency (2024). Sentinel-1 Mission Status Report. ESA Publications.
10. National Oceanic and Atmospheric Administration (2023). VIIRS Day-Night Band Operational Status. NOAA Technical Memorandum.