
This piece is the complete Chapter 2 of The Declaration of the Age of Physical Economics (Yoon Jong-won, Yoon So-ri, Yoon Jun). It is an academic exposition presenting the authors' physical economics hypothesis, and the body, figures, and citations follow the manuscript as written.
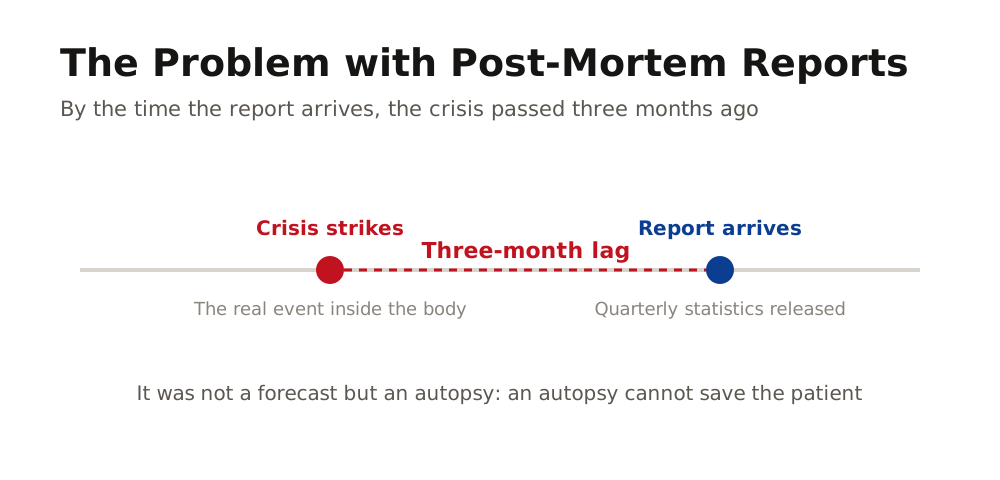
In the previous chapter, we confirmed the first limitation of existing economic diagnosis. It was the fact that single indicators alone, such as GDP, interest rates, and the CPI, cannot judge the whole-body health of the economy. But even if we look at multiple indicators together, what if the information those indicators show is already data that has become the past? Can you diagnose today's patient by looking at an X-ray taken three months ago?
In this chapter, we examine the second structural limitation of existing economic reports. That is the failure of timing. A health-checkup result sheet that arrives after the patient has already collapsed is not a diagnosis but an autopsy. And today's economic reports are playing exactly the role of that autopsy report.
Diagnosing a Patient with a Photograph from Three Months Ago: The Structural Lag of Quarterly Reports
Let us look concretely at how old the data handled by economic reports actually is. GDP, the most basic indicator for judging a country's economic condition, is published quarterly. The U.S. Bureau of Economic Analysis (BEA) releases the advance estimate about four weeks after the relevant quarter ends, and thereafter the preliminary and final figures are published in sequence, undergoing several revisions. The Bank of Korea likewise publishes the GDP advance estimate about four weeks after the relevant quarter ends. This is the best case. On the basis of this advance estimate, it takes an additional several weeks to several months for an analytical report to be written and reflected in policy.
The International Monetary Fund's (IMF) World Economic Outlook (WEO) has an even larger lag. The IMF begins its work in January and June each year and publishes its reports in April and October. Update editions are sometimes released in between, but on the basis of the formal reports, a lag of up to six months exists. The Organisation for Economic Co-operation and Development's (OECD) Economic Outlook is also published twice a year, and the Bank of Korea's economic outlook report is likewise quarterly-based.
Let us use an analogy with the human body to see why this is a problem. You went to the hospital today, but the doctor pulled out an X-ray taken three months ago. In those three months, cancer may have metastasized, additional calcium may have been deposited in the blood vessels, and bone density may have fallen further. Yet the doctor makes the diagnosis looking only at the photograph from three months ago. What is even more serious is that it took another few weeks for this photograph to reach the doctor. What the doctor is looking at is, in effect, the patient's condition from four months ago.
The Publication Lag of Major Economic Reports: The Data You Are Looking at Now Is Already the Past
| Report / Indicator | Publication Cycle | Data Lag | Human-Body Analogy |
|---|---|---|---|
| U.S. GDP (BEA) | Quarterly | 4 weeks after quarter ends (advance estimate) | X-ray from 3 months ago |
| Korea GDP (Bank of Korea) | Quarterly | 4 weeks after quarter ends (advance estimate) | X-ray from 3 months ago |
| IMF World Economic Outlook | Twice a year (April, October) | 3 to 4 months from start of work to publication | Comprehensive checkup from 6 months ago |
| OECD Economic Outlook | Twice a year | Similar lag | Comprehensive checkup from 6 months ago |
| Credit ratings (Moody's, etc.) | Irregular (based on quarterly financial statements) | At least a quarter's lag | Last season's fitness measurement |
The message of this table is clear. The economic data a policymaker refers to today reflects a situation from at least one month and at most six months ago. When the economy is stable, this lag may not be a major problem. But when the economic situation is changing rapidly, this lag is fatal. Because while the doctor is looking at the photograph from three months ago, the patient's blood vessels may already be blocked.
Economic Outlooks That Became Autopsy Reports: Four Major Cases of Global After-the-Fact Diagnosis
Let us look at what results the lag in data actually brought about, through four cases.
The first case is the United States in 2007. In May 2007, Ben Bernanke, then chairman of the U.S. Federal Reserve (the Fed), announced in an official setting that the possibility of the problems in the subprime mortgage market spreading to the economy as a whole was limited. The data the Fed referred to at the time were figures up to the first quarter of 2007, and GDP was showing sound growth. Yet at that very point, the subprime mortgage delinquency rate was already rising, and the decline in housing prices was accelerating. It took several more months for this change to be reflected in the official data. Sixteen months later, in September 2008, Lehman Brothers went bankrupt and the global financial system collapsed.
The second case is Greece. Greece passed the European Union's review of fiscal soundness. The review criteria relied on the past fiscal data submitted by the Greek government. But when a new government took office in 2009, it was revealed that the previous government had reported a fiscal deficit of 3.7 percent of GDP, whereas the actual figure reached 12.7 percent. The difference between the numbers 3.7 percent and 12.7 percent was not a simple margin of error. The gap of 9 percentage points meant that the reported data itself had been manipulated, and it shows that a review based on past data failed entirely to reflect the current fiscal condition. Greece subsequently requested a bailout from the IMF and the European Union, and in the end had to go through a large-scale debt restructuring. This case, in which not only the lag in data but also the reliability of the data collapsed, shows that the statistics themselves can be false. When statistics are false, the only thing to rely on is a signal from outside the statistics, namely the physical changes that satellites capture.
The third case is the 2023 collapse of Silicon Valley Bank (SVB). Moody's had maintained an investment-grade credit rating for SVB. Credit rating assessments are based on quarterly financial statements. But when SVB disclosed a loss on its bond sales on March 8, 2023, depositors began withdrawing their funds online that very day. In just a single day, 42 billion dollars flowed out. The next morning the bank was closed. From disclosure to closure took less than two days. A credit rating assessment based on quarterly financial statements could never catch this speed. It took less than two days for the patient's heart to stop, but the health checkup came once every three months.
The fourth case is the United Kingdom in 2022. In September of that year, the government of Prime Minister Liz Truss announced a mini-budget that included large-scale tax cuts. A prior assessment of fiscal soundness was carried out, but the market's reaction far outpaced the speed of the assessment. Immediately after the announcement, the value of the pound plunged, UK government bond yields soared, and pension funds faced margin calls, forcing the Bank of England to intervene urgently. From the policy announcement to the crisis was a mere two weeks. It is a case in which a stark difference in speed was revealed between a prior assessment based on fiscal data and the market's real-time reaction.
Four Major Cases of Global After-the-Fact Diagnosis: When the Diagnosis Arrived, the Patient Had Already Collapsed
| Case | Last Official Diagnosis | Onset of Crisis | From Diagnosis to Crisis |
|---|---|---|---|
| Bernanke / subprime | 2007.5 "spread limited" | 2008.9 Lehman Brothers bankruptcy | 16 months |
| Greece EU review | Fiscal soundness "passed" | 2010 bailout requested | About 1 year |
| SVB credit rating | Moody's investment grade maintained | 2023.3.10 bank closed | 48 hours |
| UK mini-budget | 2022.9 fiscal soundness assessment | Pound plunge, pension crisis | 2 weeks |
The four cases share a common pattern. Between the point at which the official diagnosis was made and the point at which the actual crisis occurred, an unbridgeable gap existed. And during this gap, the state of the economy was deteriorating rapidly, but the existing report systems failed to detect that change. When the diagnosis arrived, the patient had already collapsed.
The Crisis Keeps Getting Faster, but the Reports Are Still Slow: The Change in the Speed of Economic Crises
There is a more serious problem. The pace at which economic crises unfold is getting faster and faster. The 1997 Korean foreign exchange crisis unfolded over several months. It began with the bankruptcy of the Hanbo Group in January 1997, and major conglomerates such as Sammi, Jinro, and Kia collapsed in a chain. As foreign banks began to withdraw their loans, foreign exchange reserves were rapidly depleted, and it took about eleven months until the IMF bailout was requested in December.
In the 2008 global financial crisis, the bankruptcy of Lehman Brothers spread across the entire world within weeks. The 2022 UK mini-budget crisis exploded within two weeks. And the 2023 collapse of Silicon Valley Bank was completed in a mere 48 hours. As digital banking and social media combined, the speed at which information spreads and the speed at which funds move surpassed physical limits. At SVB, depositors did not stand in line and wait at the bank counter. Tens of billions of dollars flowed out via smartphones within a few hours.
The Change in the Speed at Which Economic Crises Unfold: The Crisis Keeps Getting Faster, but the Reports Are Still Slow
| Economic Crisis | Speed of Unfolding | Report Cycle at the Time | Detectability |
|---|---|---|---|
| 1997 Korea IMF foreign exchange crisis | About 11 months | Quarterly reports | Theoretically possible but missed |
| 2008 Lehman bankruptcy | Weeks | Quarterly reports | Impossible on a quarterly cycle |
| 2022 UK mini-budget | 2 weeks | Twice-a-year economic outlook | Completely impossible |
| 2023 SVB collapse | 48 hours | Quarterly financial statements | Absolutely impossible |
The trend this table points to is clear. The speed at which economic crises unfold has become about 150 times faster, from 11 months to 48 hours, but the cycle of economic reports is still quarterly or semi-annual. This is like an emergency patient being brought in while the health-checkup results come out three months later. In the emergency room, from the moment the patient enters, an electrocardiogram is connected, oxygen saturation is measured, and blood pressure is tracked continuously. They do not pull out checkup results from three months ago. The economy needs this kind of real-time monitoring too.
Attempts to Reduce the Lag: The Limits of Nowcasting and Big Data
Several institutions that recognized the seriousness of the lag have made attempts to reduce it. The Federal Reserve Bank of Atlanta's GDPNow, rather than waiting for quarterly GDP, estimates the current quarter's growth rate in real time with a nowcasting model updated once a week. The IMF also operates its own nowcasting, and the Bank of Korea is likewise pursuing a similar attempt. In the private sector as well, the JPMorgan Chase Institute tracks consumption trends with card payment data, and Mastercard SpendingPulse estimates retail sales from card usage.
These attempts clearly reduced the lag. In the place where quarterly reports had a four-week lag, weekly updates and daily updates took hold. But all of these attempts ran into the same limitation. That is because the output variable ultimately remains a single variable. GDPNow outputs only the GDP growth rate. SpendingPulse looks only at the single variable of card payments. The lag was reduced, but the limitation of a single signal remains as it was. Even if you measure the patient's blood pressure every minute, if you look only at blood pressure alone, you do not know the liver values.
But there is one signal faster than statistics compiled by humans. It is the physical signal that satellites capture. Nighttime lights satellites (DMSP/OLS, VIIRS) measure the level of activity of cities and factories every night. Land surface temperature satellites (Landsat) capture the heat of industrial operation. Radar satellites (Sentinel-1) detect changes in built structures. This physical change occurs before the statistics are compiled, and it is usually two to three months faster than the release of government statistics. When a factory is switched off, the light disappears; when a city overheats, the surface temperature rises; and when construction stops, the radar signal changes. Even when Greece manipulated its statistics, the satellites did not lie.
The Difference Between Attempts to Reduce the Lag and Satellite Data
| Diagnostic Tool | Data Lag | Measured Variable | Limitation |
|---|---|---|---|
| IMF World Economic Outlook | 3 to 6 months | GDP outlook (single) | Lag + single variable |
| Atlanta Fed GDPNow | Updated once a week | GDP nowcasting | Lag reduced but single variable |
| Mastercard SpendingPulse | Monthly (advance) | Card payments single (consumption) | Single signal |
| DMSP/VIIRS nighttime lights satellites | Real time (daily) | Urban activity physical signal | 2 to 3 months ahead of statistics release |
| 9-axis 59-gauge + satellites | Monthly + real time | Multi-axis + physical verification | Lag, single-variable, and verification solved at once |
When daily data and 15-minute quasi-real-time data are combined with satellite physical signals that capture change before the statistics are released, the three-month lag can be dramatically reduced. If there were a system that examines the economy's 9 organ systems every month with 59 gauges, and detects change before the statistics arrive using satellites, then diagnosis rather than autopsy becomes possible. And these six months of advance detection are not merely a saving of time. They are the window in which policy can work, and only while that window is open does a prescription have meaning. The concrete structure and operating principle of this system are laid out from Chapter 14 of this book.
Conclusion
The core of what we examined in this chapter is the second structural limitation of existing economic reports, namely the failure of timing. Even the GDP advance estimate takes four weeks after the quarter ends, the IMF World Economic Outlook is published twice a year, and credit ratings are based on quarterly financial statements. In between, the economic situation can change rapidly, and it actually did. Bernanke belatedly learned that his judgment from 16 months earlier had been wrong, and Moody's realized that its rating from 48 hours earlier had become meaningless only after the bank had shut its doors.
The speed at which economic crises unfold has become about 150 times faster, from 11 months in 1997 to 48 hours in 2023. Yet the cycle of economic reports is still quarterly. Unless this gap is narrowed, economic diagnosis can only remain an autopsy. Nowcasting and big data reduced the lag, but the limitation of a single variable remains as it was, and only when satellites, multi-axis combination, and a multiplicative structure come together does a diagnosis that surpasses the limit of the lag become possible.
Following the limitation of what to look at, this time we examined the limitation of when to look. But even if we solve both the object of observation and the timing of observation, there is one more problem remaining. Suppose we finish the diagnosis and issue a prescription, but that medicine does not reach the patient. What then? In the next chapter, we examine why policy is always off-beat, and why the government's prescription fails to reach the shops in the back alley.
References
1. An, Z., Jalles, J. T., & Loungani, P. (2018). How Well Do Economists Forecast Recessions? IMF Working Paper, WP/18/39. doi:10.5089/9781484338643.001
2. IMF Independent Evaluation Office (2014). IMF Forecasts: Process, Quality, and Country Perspectives. Evaluation Report.
3. Federal Deposit Insurance Corporation (2023). FDIC's Supervision of Silicon Valley Bank. FDIC Review, September 2023.
4. European Commission (2010). Report on Greek Government Deficit and Debt Statistics. COM(2010) 1, January 2010.
5. Bank of England (2022). Financial Stability Report, October 2022. Bank of England.
6. U.S. Bureau of Economic Analysis (2007). Gross Domestic Product: Third Quarter 2007 (Final). BEA News Release, December 20, 2007.
7. Bernanke, B. S. (2007). The Subprime Mortgage Market. Speech at the Federal Reserve Bank of Chicago's 43rd Annual Conference on Bank Structure and Competition, May 17, 2007.
8. Federal Reserve Bank of Atlanta (2024). GDPNow Methodology. FRB Atlanta Working Paper.
9. Elvidge, C. D., Baugh, K. E., Zhizhin, M., Hsu, F.-C., & Ghosh, T. (2017). VIIRS Night-Time Lights. International Journal of Remote Sensing, 38(21), 5860-5879.
10. JPMorgan Chase Institute (2023). Household Income and Spending Through the Pandemic. JPMCI Report.