
In the previous two chapters, we read at length through the grammar of gradient inside the human body. We saw the pressure gradient wearing down and becoming hypertension, the signal-transduction gradient becoming blocked and becoming diabetes, the perfusion gradient of the brain's microvasculature collapsing first and Alzheimer's beginning, the blood-flow gradient of the subchondral bone being cut off and arthritis growing, the filtration gradient of the glomerulus being consumed and chronic kidney disease progressing, and finally the extreme landscape of cancer unfolding on top of the environment created by hypoxia, acidosis, inflammation, and gradient collapse. The common subject of all these scenes was one. This simple principle, that if the gradient is alive the system lives and if the gradient collapses the system collapses, was merely repeated with a different face for each organ.
This chapter tests this principle in the most rigorous way. If the grammar of gradient is truly universal, it must operate in the same form even in a non-bodily system. Among such systems, the one that seems farthest from the human body while possessing the same level of complexity and dynamics is precisely the economy. This chapter asks whether the economy is moving on top of the same physical grammar as the human body, and confirms the answer with measured data. The answer is clear. The same grammar operates in the same form. The first half of this chapter prepares the logic that shows this fact, and the second half presents, in concrete numbers, how this grammar predicted crises in the 690-month time series of Korea and the United States.
Let me first make one thing clear. This chapter is not a chapter that argues a new theory of economics. It is a chapter that shows the fact that the physical language of gradient operates in the same form in the specific domain of the economy as it does in medicine. The crisis analysis that economists have built up over decades is in a complementary relationship, not a substitutive one, with the discussion of this chapter. The diagnostic engine this chapter presents was not made to replace existing early-warning systems, but to add a layer that those systems cannot catch. This perspective determines the tone of this entire chapter.
Seeing the Economy as a Flow System
There are broadly two ways of understanding the economy. One is the microscopic view that places at the center the rational choices of each economic agent and the equilibrium their aggregate creates, and the other is the macroscopic view that places at the center the movement of aggregate variables such as total output, prices, and employment. This book adds a third view. It is the view of seeing the economy as a flow system. From this perspective, the economy is a circulatory system in which the medium of money flows between the four major sectors of households, businesses, finance, and government, and the gradient of this circulation (the potential difference that makes flow from one side to the other possible) determines the health of the system.
This view is not at all new. Since William Petty in the 17th century, economics has likened the economy to blood circulation, and François Quesnay's 18th-century Tableau Économique is the first document to express this analogy as a systematic diagram. Entering the 20th century, John Maynard Keynes's income circulation model, Wassily Leontief's input-output table, and the recent flow-based SFC (Stock-Flow Consistent) models all belong to the tradition of seeing the economy as a network of flows. The framework of this book is closer to the work of formalizing this tradition once more with the physics concept of gradient.
The core variable of the formalization is the circulation flux Φ(t). In an economy, the amount of flow at each point in time is expressed as the product of the inflow on the supply side (Inflow, I) and the outflow on the discharge side (Outflow, O). Φ(t) = I · O. When this product is maintained above a certain level, the economy circulates healthily, and when one side weakens, the other compensates and holds on. But when the two variables worsen simultaneously, the product plunges nonlinearly, and at that moment the economy switches from recovery mode to survival mode. The dual function of supply and discharge that we saw in the body's microvasculature is repeated as it is in economic circulation.
The second core variable is the time derivative of flow, S(t) = dΦ/dt. It is the rate of change of the circulation flux, that is, the gradient of whether the economy is getting healthier or worsening. The hypothesis of this book is simple. A crisis is foretold not at the moment Φ falls below a certain threshold, but at the moment S accelerates in the negative direction above a certain level. In other words, not the value but the rate of change moves first, and that movement foretells a crisis several months later. This is the physical reason the predictability of this entire chapter holds.
The Material Equation: The Five Pairs of Body and Economy
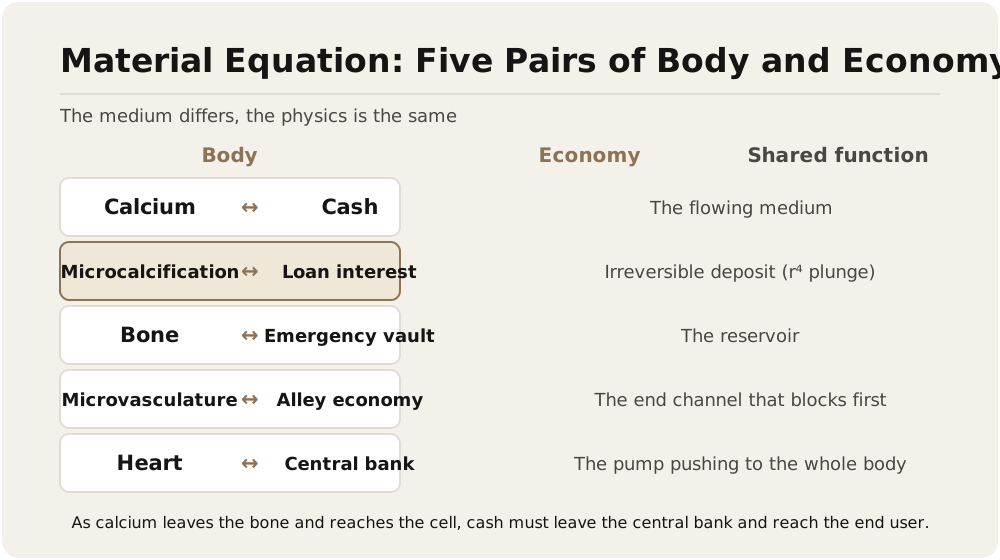
To read the economy and the human body in the same grammar, an exact correspondence must hold between the constituent elements of the two systems. This book has organized this correspondence into five pairs, and all discussion of this chapter unfolds on top of these five pairs. The following table is its content.
| Body | Economy | Common function |
|---|---|---|
| Calcium | Cash | The medium that leaves the storehouse, rides the pathway, and reaches the end user |
| Microcalcification | Loan interest | The deposit that accumulates irreversibly, narrows the effective pathway, and sharply reduces flow by r⁴ |
| Bone | Emergency vault | The storehouse that stores the medium and releases it when needed |
| Microvasculature | Alley economy | The peripheral pathway that is blockaded first in a crisis (small businesses, small and medium enterprises) |
| Heart | Central bank | The pump that pushes the medium out to the whole body |
The first row of this table is the most important. Just as the medium in the body is calcium, the medium in the economy is cash. Just as calcium must leave the storehouse that is bone, flow through the vessels, and reach the cells that need it, cash must leave the storehouses that are the central bank and commercial banks, flow through the financial system, and reach the end user. Just as cells die when this flow is cut off, businesses and households go bankrupt when this flow is cut off. The media differ, but the physics is the same.
The correspondence of microcalcification and loan interest in the second row is one of the most important insights of this book. The body's microcalcification accumulates irreversibly on the vessel walls and tissue, narrows the effective inner diameter, and decreases flow nonlinearly. The economy's loan interest is drawn out at a fixed proportion each month from the disposable income of households and businesses and accumulates irreversibly, and when the debt-repayment pressure exceeds a certain proportion of income, the disposable flow plunges nonlinearly. Both phenomena follow the same physical law in that they appear at first like a small decrease and then show a plunge proportional to the fourth power of r at the critical point, and in that, once accumulated, they cannot easily be reversed. In Chapter 9, we saw the figure that when the vessel radius decreases by 10%, the flow rate decreases by 34%. That, in the economy, consumption shows a similar nonlinear decrease when the ratio of debt repayment to household disposable income crosses a certain threshold is a fact that many empirical studies have confirmed.
The remaining three pairs (bone and emergency vault, microvasculature and alley economy, heart and central bank) show the same functional correspondence in their respective places. In particular, the correspondence in the fourth row, of microvasculature and alley economy, is a theme that will be confirmed repeatedly in this chapter. When an economic crisis progresses, what collapses first is not big business but small businesses and small and medium enterprises, and this is not a social observation that the damage of a crisis is concentrated on the weak, but an expression of the circulatory-system law that the peripheral circulation pathway is physically blockaded first. Just as the early stage of a cerebral infarction begins in the body not from the large vessels but from the microvasculature, the early stage of an economic crisis begins not from the securities market but from the fund circulation of local small businesses.
The Economic Meaning of Dual Blockade: Signal Blockade and Channel Blockade
In Chapter 9, we saw that the body's dual blockade is formalized along two axes, CAM and DLT. CAM is the Conductance Attenuation Metric, that is, the CAM = Δ/I indicator that represents the functional attenuation of signal conductance, and DLT is the Deposition-induced Luminal Throttling, that is, the DLT = 1 − Φ_act/Φ_exp(Δ) indicator that represents the physical narrowing of the lumen due to deposition. It must be noted that neither definition contains a medium-specific word such as "calcium" or "microcalcification." CAM is merely the ratio of input to response, and DLT is merely the ratio of actual flux to expected flux. This medium-independent definition is the fundamental reason the same two indicators can be applied as they are to the completely different domain of the economy.
The variable substitution of the CAM indicator in the economy is done as follows. The input I is the policy signal the central bank sends out (a change in the base rate, the scale of quantitative easing, an increase in fiscal spending), and the response deficit Δ is the size by which the real economy's reaction to that signal (the movement of new loans, business investment, household consumption) has decreased relative to the normal value. In a healthy economy this value is maintained close to 0, and the more the system fails to absorb the signal, the larger the value grows. The liquidity trap is a classic expression of economics, but if the phenomenon it points to is formalized as an indicator, it is precisely a rise in CAM. The experience in which, after 2008, inflation and growth fell short of target despite major countries reaching zero interest rates is a case of a stretch in which the CAM value remained high for a long time. It is physically the same as the state of insulin resistance in which the calcium receptors of the cell membrane are covered and cannot receive the hormone signal. Only the variables of the same formula have changed.
The variable substitution of the DLT indicator in the economy is as follows. Φ_act is the actual fund flux observed under a given driving force (the interest rate difference, the change in fund supply), and Φ_exp(Δ) is the fund flux that would be expected at that driving force had there been no deposition of debt and interest. In a healthy economy DLT converges to 0, and the more household, business, and government debt accumulates structurally and the repayment burden rises, the larger the value grows. The speed of the increase has the same gradient as the body's r⁴ nonlinearity. According to what Stephen Schularick and Alan Taylor established in a study published in the American Economic Review in 2012, a country in which private credit expanded above a certain speed relative to GDP has a statistically significantly higher probability of experiencing a financial crisis within an average of 5 to 7 years thereafter (Schularick & Taylor, 2012, American Economic Review). This statistical observation structurally coincides with the formula's prediction that the crisis probability rises nonlinearly in an economy whose DLT value has risen above a certain level. The credit-to-GDP gap indicator developed by Claudio Borio and Mathias Drehmann of the BIS is also based on the same observation (Borio & Drehmann, 2009, BIS).
The verdict indicator of dual blockade is defined as the product of the two indicators, B = CAM · DLT. This multiplicative structure automatically guarantees, mathematically, the empirical observation that system collapse does not occur from a single blockade alone. If one side is within the normal operating range (≈0), the entire product is also close to 0 and cannot cross the threshold, and only when both sides grow sufficiently large does the product rise above the threshold. Even if the signal weakens, if the channel is alive it can be compensated by an alternative pathway, and even if the channel narrows, if the signal is accurate it can be maintained by raising efficiency. But when the two axes form simultaneously, the alternative pathway disappears, and in this state the system abandons recovery mode and switches to survival mode. This turning point of the economy is precisely the crisis, and the four measured cases we will show in the second half of this chapter are all reconstructed around the point at which the B value rose above the threshold.
Let me note one more thing before moving on. This physical definition of crisis does not completely conflict with the traditional definition of crisis in economics. The existing definition identifies a crisis mainly through outcome indicators (a stock market crash, GDP decline, a surge in unemployment, financial institution bankruptcy). The definition of this book identifies a crisis through the structural condition that precedes the outcome indicators (the simultaneous formation of signal blockade and channel blockade). The difference between the two definitions is a difference in when the crisis is recognized, and this difference makes the six-month leading warning possible.
Can the Economy Be Diagnosed by Gradient
The discussion so far has confirmed a conceptual correspondence. We have shown that the constituent elements of the body and the economy correspond, and that the two axes of dual blockade operate in the same form on both sides. But this alone cannot be said to establish a theory. There is a large gap between the fact that a correspondence looks plausible at the conceptual level and the fact that that correspondence has predictive power in actual data. The starting point of science is conceptual similarity, but the destination of science is empirical verification. The next part of this chapter is the place where we show the result of that verification.
For the verification, the author designed a diagnostic engine that transplanted the body's DIAH-7M framework as it is onto the economy. This engine has two features. First, it was not made by gathering and combining existing indicators of economics, but by corresponding the framework of medicine to the economy. Second, the design came first and the verification came later. The engine was made first, and then it was observed what results emerge when that engine is applied to the past 690-month time series of Korea and the United States. This order is important. The parameters of the engine were not adjusted after the fact to fit past crises; the structure derived from medical principles was applied as it is to the economic data.
This design order gives the results of the diagnostic engine the status of an independent verification. If this engine had started from an economist's empirical intuition and been adjusted to fit past crises, the engine's high predictive accuracy could also be simply the result of overfitting. But if the structure of the engine came from a medical framework and high accuracy emerged when the economic data was substituted in after the fact, that becomes powerful evidence that the physical grammar of gradient operates across domains. The second half of this chapter is precisely the place that presents that evidence.
The Structure of the DIAH-7M Economic Diagnostic Engine
The structure of the engine takes as its axes the 9 economic domains that correspond to the body's 9 organ systems. Each axis includes several gauges that measure the flow state of that domain, and the number of total gauges is 59. Listing only the names of the 9 axes, they are as follows. The household consumption circulation axis, the business investment circulation axis, the financial credit circulation axis, the foreign exchange and external transaction axis, the housing and asset market axis, the labor market axis, the government and fiscal axis, the prices and currency axis, and the interest rate and term structure axis. This classification of the nine axes is the result of corresponding to the economy the functional roles of the body's nine organ systems: the cardiovascular, digestive, immune, respiratory, urinary, musculoskeletal, nervous, endocrine, and integumentary systems.
Within each axis, gauges are divided into three types. First, the volume gauge that measures the amount of flow. Second, the gradient gauge that measures the speed and direction of flow. Third, the resistance gauge that measures the degree of blockage of flow. When these three types of gauges in one axis all move in the worsening direction, it is judged that blockade has formed on that axis. And when blockade forms simultaneously on more than a certain proportion of the nine axes, it is judged that system-level dual blockade has formed. This is the basic verdict logic of the engine.
The data that goes into the gauges are all publicly available official statistics. For Korea, the Bank of Korea Economic Statistics System (ECOS), Statistics Korea's KOSIS national statistics portal, and Financial Supervisory Service disclosure materials were used, and for the United States, the Federal Reserve Economic Database (FRED), the U.S. Department of Commerce's Bureau of Economic Analysis (BEA), and the Bureau of Labor Statistics (BLS) materials were used. On a monthly time-series basis, Korea's data covers 351 months from January 1997 to March 2026, and the United States' data covers 339 months from January 1998 to March 2026, for a total of 690 months of data as the object of analysis. The internal calibration parameters of the engine are not disclosed in the main text of this book, but the axis-by-axis state that formed the basis of the monthly verdict is preserved in the author's internal records.
Let me specify one more thing. The engine's verdict is binary. Each month, for each axis, it judges one of "blockade formed" and "blockade not formed," and it synthesizes the verdict results of the nine axes to judge the system-level state. The reason this simple binary structure is important is that, unlike a complex weighted average or a machine-learning-based scoring method, the basis of the verdict is transparently revealed axis by axis, and it is possible to accurately reconstruct after the fact what trajectory each axis showed before and after a crisis. This is the same as the clinical mode of thinking in medicine, in which a doctor classifies each of a patient's various indicators as normal or abnormal and then judges the overall state.
690 Months: The Verification Design of the Two Korea-U.S. Time Series
After the engine was designed, that engine was applied to the past 690 months of Korea and the United States. The object of verification is the major economic crises that occurred in this period. The identification of crises followed not the engine's verdict but the standards officially recognized after the fact by academia and international organizations. In the case of Korea, the events officially identified as crises by the Bank of Korea and the IMF (the 1997 foreign exchange crisis, the 2003 card crisis, the domestic transmission of the 2008 global financial crisis, and the 2020 COVID economic shock) were taken as the standard, and in the case of the United States, the National Bureau of Economic Research's (NBER) recession determinations and the Federal Reserve's records of emergency intervention (the 1998 LTCM crisis, the 2001 dot-com collapse, the 2008 global financial crisis, and the 2020 COVID economic shock) were taken as the standard.
What the verification sought to confirm was two things. First, whether the point of dual-blockade formation that the engine identifies coincides with or precedes these official crisis points. Second, whether a crisis followed in the cases where dual blockade formed, and whether a crisis actually did not occur in the cases where dual blockade did not form. Both questions are matters of the discriminative power basically required in medical diagnostic testing, and the same form of question applies as it is to economic crisis prediction as well.
This verification design has one powerful falsification condition built in. If a system-level crisis had occurred from the blockade of a single axis alone, the engine's dual-blockade theory would be wrong. Also, if dual blockade formed but a system-level crisis did not occur thereafter, the engine's verdict criterion would be too lenient. If either of these two falsification conditions is confirmed in measurement, the argument of this chapter loses much of its force. The strength of a scientific claim is determined not only by how much data supports it, but also by how concretely it could have been wrong. The engine of this chapter entered the verification carrying both falsification conditions, and in the following part 2 we show that result through the measurement of four crises.
This article is part (1/3) of the three-part series covering Chapter 11 of The Universal Law: Gradient. The references are consolidated in part (3/3). The body text follows the original manuscript and is provided for informational purposes.