
This piece is the complete Chapter 16 of The Declaration of the Age of Physical Economics (Yoon Jong-won, Yoon So-ri, Yoon Jun). It is an academic exposition presenting the authors' physical economics hypothesis, and the body, figures, and citations follow the manuscript as written.
Why Three Layers
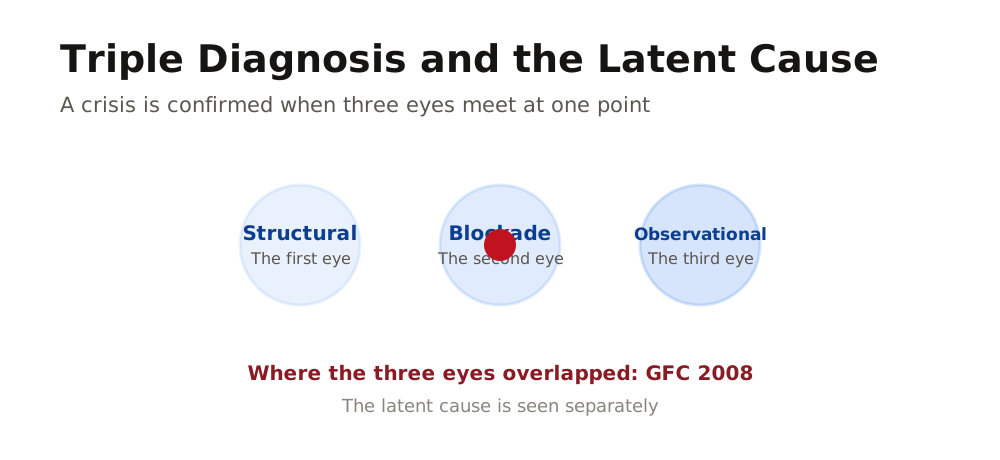
The diagnosis of DIAH-7M is composed of three layers. Structural diagnosis measures how much the flow paths of the economy have narrowed over several years. Blockade diagnosis judges each month, with 59 gauges, whether the flow has been blocked. Observational diagnosis confirms changes in physical economic activity by satellite. It is a structure in which the three layers answer different questions with different tools, yet the diagnosis is confirmed only when they independently converge on the same conclusion.
The reason the three layers must be independent lies in a single limitation. No matter how precise the 59-gauge engine is, as long as its input data is government statistics, it cannot escape the limits of lag and revision. When the engine outputs that dual blockade has formed, the engine alone cannot determine whether that is a physical collapse of economic flow or an illusion created by statistical noise. The three-layer structure, in which structural diagnosis confirms the physical preconditions, blockade diagnosis judges whether blockade has formed, and observational diagnosis independently confirms physical reality by satellite, resolves this limitation.
These three layers differ in both time scale and data source. Structural diagnosis captures change over several years, blockade diagnosis captures monthly measured values, and observational diagnosis captures real-time physical signals. Structural diagnosis uses structural indicators, blockade diagnosis uses public economic indicators, and observational diagnosis uses satellite physical signals. The time unit they use is different, the data that comes in is different, and the question they ask is different. The probability that all three go wrong in the same direction at the same time is extremely low.
In medicine, when a patient says their chest feels tight, the doctor does not trust the self-report alone. They take an electrocardiogram, measure cardiac enzymes in the blood, and look at a coronary CT together. Only when three independent pieces of information point to the same conclusion is the diagnosis of myocardial infarction finally confirmed. This is exactly the principle that the three layers of DIAH-7M follow.
Design of the Physical-Flow-Based Triple Diagnostic System
| Diagnostic layer | Question asked | Verification tool | Time scale |
|---|---|---|---|
| 1. Structural diagnosis (weakening) | How much have the economy's flow paths narrowed over several years | 9 to 11 structural gauges | Multi-year |
| 2. Blockade diagnosis (occlusion) | Is the flow blocked now | 59 gauges across 9 axes, CAM (signal blockade) and DLT (channel blockade) judgment | Monthly |
| 3. Observational diagnosis (verification) | Does the satellite confirm actual change | Nighttime light satellite, surface temperature satellite, radar satellite | Real time |
The First Eye, Structural Diagnosis
Structural diagnosis measures how much the blood vessels of the economy have narrowed over several years. It looks not at the change over a month or a quarter, but at cumulative change over the span of several years to a decade. The gauges number 9 to 11. Indicators that move slowly in the deep places of the structure enter here: the household debt service ratio, the savings rate, the house-price-to-income ratio, the Gini coefficient, the current account balance as a ratio to GDP, federal interest payments as a ratio to GDP, and so on.
These gauges are divided into three bundles. The first bundle is the depth of income polarization. Indicators such as the Gini coefficient, the income share of the top 10 percent, and the gap in household disposable income enter here. How much income is skewed to one side in a society becomes, in the end, the deepest cause of the severance of the consumption channel. The second bundle is the depth of cost accumulation. These are indicators such as the household debt service ratio, the share of firms whose interest coverage ratio is below 1, and the house-price-to-income ratio. How thickly microcalcification (interest) has piled up in the blood vessels of households and firms is caught in this bundle. The third bundle is the depth of circulatory severance. With indicators such as the savings rate, the ratio of debt to household disposable income, and the cumulative current account deficit, it looks at how much the emergency vault (savings) has been depleted.
Transposing structural diagnosis into an everyday metaphor, it corresponds to the results sheet of the health checkup one receives each year. It is an examination that looks not at what one's blood pressure is today, but at how cholesterol has accumulated over several years, how much the vessel walls have thickened, and how the coronary artery calcium score has changed. Even if one's chest does not hurt today, if the results sheet reads "coronary artery calcium score 600, high risk," the doctor does not simply send that person away. Because the absence of symptoms is not the absence of disease.
The reason structural diagnosis measures few gauges is that structure does not change quickly. There is no case in which the household debt service ratio doubles in a single month. But the way that ratio moves from one place to another over several years shows most honestly where the deep fissures of that society are growing. If blockade diagnosis asks "is it blocked now," structural diagnosis asks "was it ready to be blocked."
The Second Eye, Blockade Diagnosis
Blockade diagnosis operates once each month. The 59 gauges are distributed across 9 organ systems and measured simultaneously, and the alarm is triggered when two conditions, cumulative and composite, are met at the same time. A single gauge worsening on its own does not change the grade; only when two kinds of blockade form simultaneously is it finally judged a crisis.
The core questions blockade diagnosis asks are two. Is the policy signal reaching households and small business owners, and is the physical channel by which households earn and spend money open. Answering the first question is the CAM (signal blockade) judgment, and answering the second is the DLT (channel blockade) judgment. The state in which both blockades form simultaneously is dual blockade, and in the 690 months of data the four Korea-U.S. cases of 2008 and 2020 where dual blockade formed all proceeded into crisis (1997 and 2003 are cases in which a single-blockade advance warning of CAM alone led into crisis).
The way blockade diagnosis operates follows the same principle as the real-time monitoring equipment of an emergency room. One patient's heart rate, blood pressure, oxygen saturation, respiratory rate, and body temperature are displayed simultaneously on the monitor and updated every moment. One indicator wobbling briefly does not set off the alarm. Only when two indicators go outside the threshold at the same time does the nurse come running, and only when three indicators enter the danger stage at the same time is the doctor called. The cumulative and composite conditions of blockade diagnosis are exactly this principle.
The reason it operates on a monthly basis is that the flow of the economy changes at about that pace of breathing. It measures at a place faster than GDP, which is announced each quarter, and more stable than the stock market, which shakes every day. A month's change is a time unit that catches only events large enough while filtering out the noise, yet catches the fast flows that could be missed if one waited for the quarter.
The Third Eye, Observational Diagnosis
Observational diagnosis looks at the earth from space. The nighttime light satellite measures each month the amount of nighttime activity of cities and factories, the surface temperature satellite catches the heat of industrial operation, and the radar satellite detects changes in built structures. When three kinds of independent physical signals point in the same direction, that is not a measurement error but a real change.
The reason the satellite is needed is that government statistics themselves have limits. The advance GDP estimate comes out only a month after the quarter ends, and the final figure two months later. Greece under-reported its fiscal deficit for years in order to join the eurozone, and the point at which this fact came to light was the ignition point of the European fiscal crisis. When statistics cannot guarantee the truth, a signal outside the statistics is needed.
What observational diagnosis does is the same as a CT or MRI examination in medicine. It is an examination in which the image directly shows what cannot be known from the patient's self-report alone. Just as a tumor can appear on the CT of a patient who says "I am fine," so too the nighttime light of a government that has announced "the economy is normal" can decrease. The satellite does not listen to the patient's words but looks at the body directly.
The reason three kinds of satellite are used together is that with a single satellite only one dimension is measured. Nighttime light measures the intensity of activity, surface temperature the heat of industrial operation, and radar the change in structures. If all three point in the same direction, it is not coincidence but reality. With the nighttime light satellite alone one cannot distinguish whether it is the result of a change in electricity policy or the result of a decrease in economic activity, but if nighttime light and surface temperature fall together, it becomes clear that industrial operation itself has decreased.
The Place Where Three Eyes Meet at One Point, GFC 2008
The 2008 global financial crisis is the case in which the triple diagnostic system first proved its value. We follow, along the flow of time, how the three layers pointed to the same point with time lags.
The signal from years before: structural diagnosis. Structural diagnosis had been capturing the underlying disease of the U.S. economy from several years before the Lehman bankruptcy occurred. The household debt service ratio reached its peak at 13.0% in 2005 and 13.2% in 2006. It was a state in which more than one seventh of household income was being sucked out into debt interest. The house-price-to-income ratio peaked at 5.1 times in 2006. It means that the average household was in a state where it needed five times its own annual salary to buy a single house. At the same point the savings rate had fallen to 2.6%, so the emergency vault was almost empty. The conclusion of structural diagnosis was clear. The foundational fissures were already deep before the crisis occurred.
U.S. GFC Structural Diagnosis: Year-by-Year Trend
| Gauge | 2005 | 2006 | 2007 | 2008 | Interpretation |
|---|---|---|---|---|---|
| Household debt service ratio | 13.0% | 13.2% peak | 12.8% | 12.0% | 2006 severe stage. Occlusion of the discharge channel |
| House-price-to-income ratio | 4.6 times | 5.1 times peak | 4.8 times | 3.9 times | 2006 severe stage. Hidden calcification at its maximum |
| Savings rate | 2.6% | 3.4% | 2.8% | 5.0% | 2005 severe stage. Emergency vault depleted |
| Gini coefficient | 0.469 | 0.470 | 0.463 | 0.466 | Chronic high level. Circulatory severance |
| Current account to GDP | -5.7% | -5.8% | -4.9% | -4.6% | Chronic deficit. Outflow from the body |
The first warning six months before: blockade diagnosis. In June 2007, two hedge funds under Bear Stearns went bankrupt. On August 9, 2007, BNP Paribas suspended redemptions on three asset-backed securities funds. On March 16, 2008, America's Bear Stearns was announced to be sold to JPMorgan Chase at 2 dollars per share. That same month the score of blockade diagnosis broke through the warning threshold for the first time. It was the first month in which several of the 9 axes entered warning simultaneously, and the active triggers were two, D (income polarization) and I (cost explosion). In April, CAM (signal blockade) was triggered. From May, the number of axes in simultaneous warning increased. In July, the score of blockade diagnosis rose to the alert stage, all four triggers D, I, A, and H were activated, and dual blockade formed before the Lehman bankruptcy. When Lehman Brothers filed for bankruptcy on September 15, 2008, blockade diagnosis had already been outputting the start of the crisis six months earlier.
U.S. GFC Blockade Diagnosis: Month-by-Month Trend (6-Month Lead Detection)
| Month | Score | Grade | Axes in simultaneous warning | Active triggers | Blockade | Meaning |
|---|---|---|---|---|---|---|
| 2008-03 | 59 | Watch | Several axes in simultaneous warning | D+I | Normal | First break through warning threshold (6 months before) |
| 2008-04 | 63 | Caution | Multiple axes in simultaneous warning | D+I+H | CAM | CAM (signal blockade) triggered (5 months before) |
| 2008-05 | 68 | Caution | Almost all axes in simultaneous warning | D+I+H | CAM | Simultaneous warning expands (4 months before) |
| 2008-07 | 72 | Alert | Most axes in simultaneous warning | D+I+A+H | Dual blockade | Dual blockade forms before Lehman (2 months before) |
| 2008-09 | 89 | Crisis | Most axes in simultaneous warning | D+I+A+H | Dual blockade | Lehman bankruptcy. Crisis confirmed |
Physical contraction seen from space: observational diagnosis. During the same period the satellite data too was pointing in the same direction. In the nighttime light satellite, the U.S. nighttime activity index fell by nearly about 20% from its peak in 2000 to its trough in 2003. This decline was already visible from space before the statistics were announced. In the surface temperature satellite, as downtown activity decreased, a phenomenon in which heat dispersed to the suburbs was observed. The two kinds of satellite pointed to the same conclusion independently of government statistics. The conclusion of observational diagnosis was "the contraction of physical economic activity is real."
The convergence of the three layers. Structural diagnosis captured the accumulation of underlying disease over several years, blockade diagnosis sounded the first warning six months before, and observational diagnosis confirmed the physical contraction independently of government statistics. As a result of the three pointing to the same place, DIAH-7M had been outputting the crisis from 8 months before the National Bureau of Economic Research (NBER) officially declared the U.S. recession on December 1, 2008. The timing of the blockade release was also accurate. The absolute trough of the S&P 500 was March 9, 2009, and blockade diagnosis output the blockade-release signal within 1 month of that, 2 months ahead of June 2009, when the NBER officially declared the end of the recession.
The United States in April 2026, the Triple Diagnosis of This Very Moment
The output results of the three layers of the April 2026 U.S. diagnostic report do not converge in one direction. Blockade diagnosis and observational diagnosis say "it is fine now," while structural diagnosis warns "it is the most dangerous ever." This non-convergent state, in which the three layers do not point to the same place, is the most difficult position of the diagnostic system.
The result of blockade diagnosis. Composite score 69, watch stage. Among the 9 axes the digestive system shows the highest stress, and the immune system and the endocrine system have entered the watch stage together. The remaining 6 axes are stable. Both signal blockade and channel blockade are normal, and dual blockade is in an undetected state. The conclusion of blockade diagnosis is "the current flow is not blocked."
The result of observational diagnosis. The year-on-year change of the nighttime light satellite is +8.4%, normal, and the recent 7-day moving average is +7.2%, showing an improving trend. The urban heat island indicator of the surface temperature satellite is at -1.2 degrees, within the normal range, and the industrial production index and the nighttime light satellite, the urban temperature and the surface temperature satellite, and the gross regional domestic product and the nighttime light satellite are all in the same direction. In the comparison of the four items of government statistics and satellite there is no divergence, and the conclusion of observational diagnosis is "physical economic activity is being maintained."
The result of structural diagnosis. Structural diagnosis points in a different direction. The house-price-to-income ratio of 5.0 times has approached the 5.1 times just before the 2008 global financial crisis. The Gini coefficient of 0.49 is the highest level among the OECD countries. The ratio of federal interest payments to GDP of 3.2% is drawing near the danger threshold. The household debt service ratio of 11.3% has left only about a 2 percentage point margin from the 13.2% just before the global financial crisis. The conclusion of structural diagnosis is "there are no current symptoms, but the underlying disease is the worst ever."
The non-convergence of the three layers: transposed onto the human body, it corresponds to a patient whose blood pressure, pulse, and body temperature are all normal but in whom a large amount of coronary artery calcium is found on the CT examination. The fact that the chest does not hurt today is no guarantee that there will be no myocardial infarction next month. This is why a device is needed that reads together the "present" that blockade diagnosis and observational diagnosis point to and the "latency" that structural diagnosis points to. That device is the two-track judgment.
Why the Latent Cause Is Seen Separately
If the triple diagnosis is three eyes that look into the "now," the two-track judgment is a device that separates and reads out the "now" and the "what has accumulated." The 9 axes of blockade diagnosis are the first track that measures current symptoms, the 7 gauges that measure the depth of the accumulation of microcalcification (debt) are the second track, and the two tracks are never averaged or summed. It is for the same reason that a doctor does not add the blood pressure reading and the CT calcium score together and take their average.
The second track answers three questions. The first question is quantity. How much microcalcification has accumulated. The ratio of household debt divided by disposable income, the household debt service ratio, and the share of firms whose interest coverage ratio is below 1 measure this quantity. The second question is speed. How fast is it accumulating. The annual growth rate of household debt and the annual growth rate of interest costs show this speed. The third question is resilience. How much can the blood vessel endure. The delinquency rate on household loans and the share of vulnerable borrowers measure this resilience.
There is a reason these three questions must be separated. Even if the quantity is large, if the speed is 0, sudden death is far off; even if the quantity is small, if the speed is fast, sudden death is near. Even with the same household debt service ratio of 11.3%, the first track (blockade diagnosis) asks "is the household bearing the interest now," while the second track (latent cause) asks "if this level continues, when will it reach the threshold." Reading the same number through a different question is the core of the two-track separation.
The 7-Gauge Structure of Latent Cause Measurement
| Type | Gauge | Question asked | Human-body analogy |
|---|---|---|---|
| Quantity | Household debt to disposable income ratio, household debt service ratio, share of firms with interest coverage ratio below 1 | How much microcalcification has accumulated | Total volume of coronary artery calcium |
| Speed | Household debt growth rate, interest cost growth rate | How fast is it accumulating | Speed of calcium deposition |
| Resilience | Household loan delinquency rate, share of vulnerable borrowers | How much can the blood vessel endure | Elasticity of the vessel wall |
The two tracks are placed side by side in the report, and a composite grade is calculated from the combination of the two. Even if the current symptoms are mild, if the latency is deep, "latency deepening" is displayed in the composite grade; even if the current symptoms are severe, if the latency is shallow, "short-term fluctuation" is displayed. If both tracks enter the danger stage, the composite grade is displayed as "sudden death risk."
Composite Grade Matrix
| Current symptoms (blockade diagnosis) | Depth of latent cause | Composite grade |
|---|---|---|
| Alert | Shallow or medium | Alert |
| Alert | Deep or very deep | Alert, latency deepening |
| Severe | Shallow | Severe, short-term fluctuation |
| Severe | Deep or very deep | Severe, structurally vulnerable |
| Dual blockade ignition | Very deep | Highest alarm, sudden death risk |
We look at how this matrix works through the contrast of two cases, the global financial crisis and COVID. Just before the 2007 global financial crisis, with the household debt service ratio at 13.2%, the savings rate at 2.6%, and the house-price-to-income ratio at 5.1 times, latency was at its deepest stage. After dual blockade formed, 6 months were needed until the blockade was released (from September 2008 to March 2009). At that time the composite grade was "highest alarm, sudden death risk." The timing of the blockade release was 1 month after the absolute trough of the S&P 500 (March 9, 2009) and 2 months ahead of the NBER's declaration of the end of the recession (June 2009).
Just before COVID in 2019, the situation was different. The household debt service ratio was mild at 9.7%, and the savings rate was sufficient at 7.5%. An external shock came in a state of shallow latency. The U.S. government passed the COVID-response bill (CARES Act) of 2.2 trillion dollars on March 27, 2020 and sent direct support payments to households, and when this money reached all the way to the microvasculature (households), the dual blockade was released in just 1 month (April 2020). The composite grade was "severe, short-term fluctuation."
It was the same dual blockade, but the blockade period differed by 6 times. The cause of that difference is the depth of latency. In the global financial crisis, the microcalcification accumulated over several years had thickly hardened the vessel walls, whereas in COVID an external shock alone was applied while the blood vessels were relatively clean. It is the same as the difference in recovery speed between a patient with a deep underlying disease catching the flu and an ordinarily healthy person catching the flu. This difference is not visible from blockade diagnosis alone. Because there is a second track that separately measures the latent cause, the reason the two cases, despite being the same dual blockade, had recovery speeds that differed by 6 times is revealed.
References
1. BNP Paribas Investment Partners (2007). BNP Paribas Investment Partners temporarily suspends the calculation of the Net Asset Value of the following funds: Parvest Dynamic ABS, BNP Paribas ABS Euribor and BNP Paribas ABS Eonia. Press release, August 9.
2. Drehmann, M., & Juselius, M. (2013). Evaluating Early Warning Indicators of Banking Crises: Satisfying Policy Requirements. BIS Working Papers No. 421.
3. European Commission/Eurostat (2010). Report on Greek Government Deficit and Debt Statistics. COM(2010) 1 final, January 8.
4. JPMorgan Chase & Co. (2008). JPMorgan Chase To Acquire Bear Stearns. Press release, March 16. (SEC Form 425).
5. Lehman Brothers Holdings Inc. (2008). Lehman Brothers Holdings Inc. Announces It Intends to File Chapter 11 Bankruptcy Petition. Press release, September 15.
6. National Bureau of Economic Research (2008). Determination of the December 2007 Peak in Economic Activity. Business Cycle Dating Committee Announcement, December 1.
7. National Bureau of Economic Research (2010). Determination of the June 2009 Trough in Economic Activity. Business Cycle Dating Committee Announcement, September 20.
8. US Congress (2020). Coronavirus Aid, Relief, and Economic Security Act (CARES Act). Public Law 116-136, March 27.