
This piece is the complete Chapter 1 of The Declaration of the Age of Physical Economics (Yoon Jong-won, Yoon So-ri, Yoon Jun). It is an academic exposition presenting the authors' physical economics hypothesis, and the body, figures, and citations follow the manuscript as written.
In the prologue we confirmed an uncomfortable report card. The crisis hit rate of the existing economic forecasting system was a mere 3.3%. Of 153 recessions, 148 were missed; credit ratings were maintained right up to 48 hours before default; and the chair of the Federal Reserve announced that the problem was contained 16 months before the financial collapse. So why did all these experts and institutions repeatedly make the same mistake?
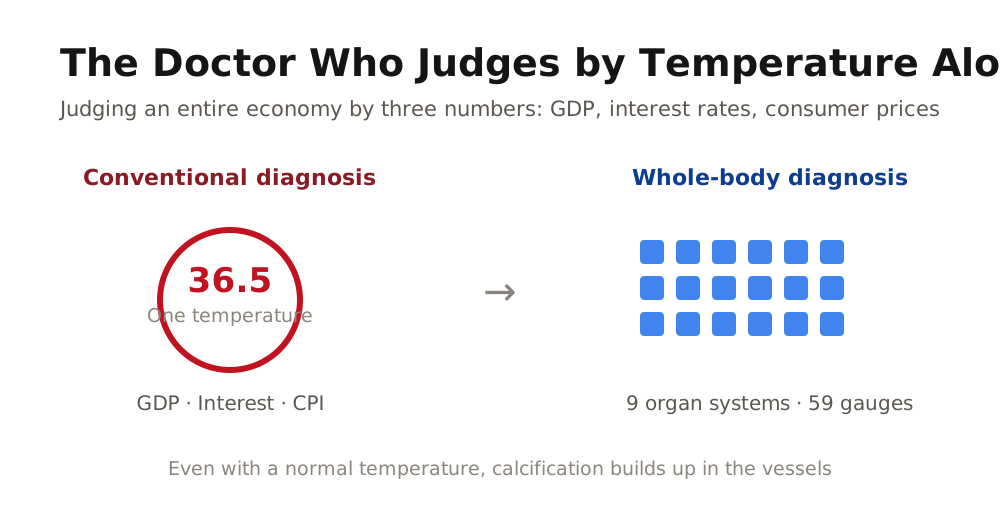
In this chapter we find the first answer to that question. The answer is astonishingly simple. It is because the very tool the experts use to see the economy is fundamentally incomplete. At present, economic diagnosis around the world depends largely on 3 indicators. They are gross domestic product (GDP), the benchmark interest rate, and the consumer price index (CPI). These 3 indicators each contain important information, but they do not show the whole picture of the economy. It is just like a doctor who measures only the body temperature and then discharges the patient.
The Doctor Who Measures Only Body Temperature and Discharges the Patient: The Trap of the Single Indicator Called GDP
GDP is the sum of the market value of all goods and services produced in a country over a given period. It is the most widely used indicator for measuring the size and growth speed of an economy, and it is the first number that policymakers and investors check when judging the health of the economy. Yet between what this number shows and what it fails to show, there is an enormous gap.
In the third quarter of 2007, the real GDP growth rate of the United States recorded 4.9% at an annualized rate. This figure, released by the U.S. Bureau of Economic Analysis (BEA), was even higher than the 3.8% of the second quarter of the same year, and the contributions of exports and consumer spending were large. Looking at this number alone, the U.S. economy was growing strongly. But at exactly that moment, the U.S. subprime mortgage market had already begun to collapse, housing prices were falling, and the bad assets of financial institutions were swelling like a snowball. The thermometer called GDP was pointing at 36.5 degrees, but inside the blood vessels of the economy, calcification was building up. Twelve months later, in September 2008, Lehman Brothers went bankrupt and the global financial system collapsed.
The reason this indicator failed to detect the crisis lies in its structural characteristics. GDP measures the total volume of economic activity, but it does not show where that activity is taking place, to whom it is flowing, or where it is being blocked. In terms of the human body, GDP corresponds to body temperature. A normal body temperature does not mean the body is healthy. Even while the body temperature holds at 36.5 degrees, liver values may be dangerous, calcification may be depositing in the blood vessels, and kidney function may be declining. A patient whose bone density has been cut in half because calcium has leached out of the bones also has a normal body temperature. In this book, calcium corresponds to cash, microcalcification to debt interest, and bone to the emergency vault. GDP is a tool that lumps these 4 flows into a single number, and that lumping becomes a screen that hides the crisis.
The book co-authored by the Nobel laureates in economics Joseph Stiglitz, Amartya Sen, and Jean-Paul Fitoussi pointed out the limits of GDP as follows. Because GDP captures only the activities traded in the market, it cannot measure non-market activities such as housework or care work. Moreover, it does not reflect the imbalance in income distribution, and it also cannot capture sustainability problems such as environmental destruction or resource depletion; this is their core argument. Even if GDP rises, if that growth is concentrated in a handful of large corporations and asset holders, the reality of the shops in the back alley and of households can be entirely different from the GDP number.
What GDP Shows and What It Hides: The Total Is Visible but the Flow Is Not
| Category | What GDP Shows | What GDP Hides |
|---|---|---|
| Object of measurement | Total production of goods and services | To whom the output flows |
| Economic size | The size and growth speed of the whole economy | The gap between large corporations and back-alley shops |
| Flow | The increase or decrease of the total | Where it is being blocked |
| Health indicator | Body temperature (36.5 degrees = normal) | Liver values, vascular calcification, kidney function |
| Case | U.S. GDP in Q3 2007, +4.9% | Subprime collapse under way at the same time |
The number 4.9% that the thermometer showed was not wrong. In reality, the total production of the U.S. economy did increase that much in that quarter. The problem is that GDP failed to show where that growth was taking place. While exports and inventory investment were pulling growth up, the housing market was already crumbling, and household debt was piling up to an unmanageable level. The blood flow in the aorta was sufficient, but in the microvasculature an infarction had already begun. This book calls the state in which the flow of funds fails to reach the microvasculature, that is, the state in which money is blocked, monetary sclerosis, and takes it up in earnest from Chapter 14.
The clearest natural experiment showing the limits of GDP took place in 2008. The same global financial crisis shock struck the United States, South Korea, and Australia simultaneously, yet the outcomes diverged completely. As the epicenter, the United States saw GDP contract by 2.5% and fell into a long recession; South Korea contracted by only 0.7% and showed a middling recovery; and Australia rebounded in a V shape almost without stopping. If the outcomes diverged this much from the same external shock, it means the difference lay in each country's underlying economic disease. In the United States the household debt service ratio had soared to 13.2%, a state in which a large amount of calcification had deposited on the vessel walls, whereas Australia's household finances were relatively healthy. The thermometer called GDP only shows that the same shock struck all three; it cannot explain why the outcomes diverged.
The Same Shock in 2008, Different Outcomes: The Difference GDP Could Not Explain
| Country | 2008 Shock Intensity | Actual Outcome | Human-Body Analogy (Difference in Underlying Disease) |
|---|---|---|---|
| United States | Epicenter (subprime) | Long recession, GDP -2.5% | Severe vascular calcification, hyperlipidemia |
| South Korea | External capital outflow shock | Middling recovery (GDP -0.7%) | Weak underlying disease, middling recovery |
| Australia | The same external shock | V-shaped rebound (growth maintained) | Almost no underlying disease, immediate recovery |
| Indicator trap | Looking only at GDP, all three took a shock | Reason the outcomes diverged unexplained | A single indicator cannot catch the difference |
The Doctor Who Looks Only at Blood Pressure: The Trap of the Single Indicator Called the Interest Rate
The interest rate is the price of money in the economy. The logic of traditional monetary policy is that when the central bank lowers the benchmark interest rate, the cost of borrowing money falls, businesses and households consume and invest more, and the economy is stimulated. In terms of the human body, the interest rate corresponds to blood pressure. It is the same logic as expecting that if you lower the blood pressure, blood will flow more smoothly.
Yet in Japan this logic failed to work for 30 years. The Bank of Japan (BOJ) introduced a zero interest rate policy in 1999, the first in the world to do so, and in 2016 it even implemented a negative interest rate. It lowered the blood pressure to the lowest possible level. But the Japanese economy did not come back to life. From 1991 to 2003, Japan's average annual GDP growth rate was only 1.14%, and over roughly 30 years from 1995 to 2025, Japan's nominal GDP actually shrank from 5.55 trillion dollars to 4.27 trillion dollars (IMF estimate). Real wages fell by about 13% from their 1997 peak.
Why did the economy not revive even though the interest rate was lowered this much? The human-body analogy gives a clear answer to this question. Lowering the blood pressure does not open a blocked blood vessel. Just as blood sugar does not come down when the cells have insulin resistance no matter how much insulin the pancreas secretes, no matter how much the interest rate is lowered, if the path along which money flows is blocked, the funds cannot reach the places that need them. In Japan the banking system was tied up in bad loans, businesses hoarded cash instead of investing, and consumers closed their wallets amid deflationary expectations. The blood pressure was at its lowest, but because the blood vessels were blocked, the blood could not reach the cells.
The Lesson of Japan's 30 Years: Even If You Lower the Blood Pressure, It Is Useless if the Vessels Are Blocked
| Period | Japan's Benchmark Interest Rate | Economic Performance | Human-Body Analogy |
|---|---|---|---|
| 1991-2003 | Cut from 6% to 0.1% | Average annual GDP growth rate 1.14% | Blood pressure lowered but vessels blocked |
| 1999 | Zero interest rate (0%) introduced | Deflation persists | Blood pressure at its lowest yet circulation stagnant |
| 2016 | Negative interest rate (-0.1%) | Consumption and investment responded weakly | State of insulin resistance |
| 1995-2025 | Held near 0% for 30 years | Nominal GDP 5.55 to 4.27 trillion dollars | Long-term vascular infarction becomes chronic |
Japan's case leaves one lesson. The interest rate is an important indicator, but the interest rate alone cannot judge the circulatory state of the economy. Just as a normal blood pressure does not mean the vessels are healthy, a low interest rate does not mean money is flowing well. To know where money is being blocked and why it is being blocked, measuring the blood pressure called the interest rate is not enough. Angiography is needed.
The Doctor Who Measures Only Body Weight: The Trap of the Single Indicator Called the Consumer Price Index
The consumer price index (CPI) is an indicator that measures the average price changes of the goods and services purchased by households. It shows how much prices are rising and plays a central role in the central bank's monetary policy decisions. In terms of the human body, the CPI corresponds to body weight. It is similar to judging that someone is healthy if the body weight is within the normal range.
In October 2022, Turkey's consumer price inflation rate exceeded 85% compared with the same month of the previous year. The economy had developed an extreme fever. The Turkish government and central bank tried various policies to curb this price rise, but because they responded looking only at the single indicator of the CPI, they missed the composite pathology. At that time in Turkey it was not only the price surge that was occurring. As the value of the lira plunged, import costs soared, foreign capital rapidly withdrew, and as trust in the independence of the central bank collapsed, investment was plummeting.
In terms of the human body, this situation is not a simple high fever. Administering only an antipyretic to a patient running a fever above 42 degrees is dangerous. This is because the cause of that high fever may not be a simple cold but sepsis. Sepsis is a state in which an infection spreads throughout the whole body and multiple organs lose function simultaneously. Turkey's economic crisis was the same. The number of 85% CPI corresponds to a state of extreme high fever, but behind it, a fall in currency value (acidosis), capital outflow (deficiency), and production paralysis (hypoxia) were progressing at the same time. A single indicator like the CPI could not catch this composite pathology.
The Composite Pathology of Turkey's 2022 Crisis: Body Temperature Alone Cannot Catch Sepsis
| Indicator | Turkey's State in 2022 | What Is Visible from the CPI Alone | The Actual Hidden Pathology |
|---|---|---|---|
| Prices (CPI) | +85% or more | Prices are the problem | Only a symptom, not the cause |
| Exchange rate (lira) | Sharp fall against the dollar | Not visible | Acidosis (A): erosion of currency value |
| Capital outflow | Foreign investment plummets | Not visible | Deficiency (D): supply of capital cut off |
| Production and investment | Corporate investment shrinks | Not visible | Hypoxia (H): production paralysis |
| Trust in the central bank | Independence damaged | Not visible | Collapse of the immune system |
The Indicator Is Not Wrong; the Problem Is Looking at Only One: The Economy as a Complex System
Synthesizing the 3 cases, one pattern comes into view. GDP was not wrong, nor was the interest rate, nor the CPI. Each indicator accurately measures what it was designed to measure. The problem lies in having tried to judge the health of the entire economy with a single indicator. Even if the body temperature is normal, the liver may be failing; even if the blood pressure is normal, the vessels may be blocked; and even if the body weight is normal, muscle may be wasting and fat may be increasing.
Various institutions that noticed this limit tried to create a single composite indicator. The Bank for International Settlements (BIS) has used the credit-to-GDP gap as a single early-warning indicator for crises, Bloomberg outputs a recession probability model as a single figure, and Moody's and Standard & Poor's condense a country's credit state into a single grade through the credit rating. But all these attempts ran into the same limit. It is because the output ultimately remains a single variable. The BIS gap looks only at debt. The Bloomberg model outputs only the recession probability. The credit rating displays only sovereign credit. A single output is a single diagnosis, and condensing the patient's whole body into one number hides where it hurts. The road from a single output to a single diagnosis ends in a dead end no matter how you extend it into multiple axes.
Recalling a human health checkup makes this problem even clearer. There is no hospital that finishes a comprehensive checkup with a single blood test. In addition to the blood test, it takes an electrocardiogram and measures lung function. It checks liver function and kidney function, examines bone density, and looks directly at the state of the organs with X-ray and ultrasound. A comprehensive health checkup usually measures 30 to 80 items at once. Only by synthesizing all these examinations can the whole-body health state of the patient be judged. The economy is the same.
The Correspondence Between the Human Comprehensive Checkup and Economic Diagnosis: Only by Examining the Whole Body Can You Know the Whole Body
| Human Examination Item | Corresponding Economic Indicator | What It Sees |
|---|---|---|
| Blood test | GDP | Total production (aggregate) |
| Blood pressure measurement | Benchmark interest rate | The price of money (liquidity pressure) |
| Body weight measurement | CPI | Price level (purchasing power) |
| Electrocardiogram | Financial stability index, VIX | The heartbeat of the financial system |
| Lung function test | Exports and imports, current account | External oxygen supply |
| Liver function test | Consumption, retail sales | Domestic demand digestion function |
| Kidney function test | Employment rate, unemployment rate | Labor market filtration function |
| Bone density test | Real estate, construction investment | The strength of the economic structure |
| X-ray, ultrasound | Industrial production, capacity utilization rate | The real state of production activity |
| CT, MRI (satellite) | Nighttime lighting, urban heat island, radar | The actual measurement of physical flows |
The message of this table is clear. GDP, the interest rate, and the CPI correspond to the blood test, the blood pressure measurement, and the body weight measurement. There is no hospital that judges a patient's health with these 3 alone. Only by synthesizing the electrocardiogram, the lung function test, the liver function test, the bone density test, and even the X-ray can the patient's state be known. Economic diagnosis is no different. Only by synthesizing the financial stability index, exports and imports, consumption, employment, industrial production, and even satellite data can we properly know where it is being blocked. This is the reason 59 gauges across 9 organ systems are needed, and it is the fundamental background of the DIAH-7M national economic diagnosis that this book will establish from Chapter 14.
Conclusion
The core point examined in this chapter is one. GDP is the body temperature of the economy, the interest rate is its blood pressure, and the CPI is its body weight. The 3 indicators each faithfully perform their own role, but no single one of them can judge the whole-body health of the economy. The United States saw its financial system collapse in the midst of 4.9% GDP growth, Japan held the interest rate at 0% for 30 years yet the economy did not revive, and Turkey responded looking only at the CPI and missed a composite crisis.
The indicator is not wrong. Looking at only one is the problem. The economy is a complex system in which countless domains are connected and influence one another. When an abnormality in one domain spreads to another domain, and when problems in several domains overlap at the same time, a crisis erupts. To detect this, the whole body must be examined. A system that looks at 59 gauges across 9 organ systems at once is the answer, and in the latter part of this book we unfold the structure and operating principle of that system.
Yet the limit of the single indicator is not the only problem with existing economic diagnosis. Even if you view multiple indicators together, what if the information those indicators show is already data of a past that has gone by? In the next chapter, we will examine another structural problem that existing economic reports carry, namely the failure of timing.
References
1. U.S. Bureau of Economic Analysis (2007). Gross Domestic Product: Third Quarter 2007 (Final). BEA News Release, December 20, 2007.
2. Stiglitz, J. E., Sen, A., & Fitoussi, J.-P. (2009). Mismeasuring Our Lives: Why GDP Doesn't Add Up. The New Press.
3. Ito, T., & Mishkin, F. S. (2006). Two Decades of Japanese Monetary Policy and the Deflation Problem. In Monetary Policy Under Very Low Inflation in the Pacific Rim, NBER-EASE, Volume 15. University of Chicago Press.
4. Krugman, P. (1998). It's Baaack: Japan's Slump and the Return of the Liquidity Trap. Brookings Papers on Economic Activity, 1998(2), 137-205. doi:10.2307/2534694
5. Bank of Japan (2024). Japan's Economy and Prices over the Past 25 Years. BOJ Working Paper Series, No. 24-E-14.
6. International Monetary Fund (2025). World Economic Outlook Database, April 2025.
7. Turkish Statistical Institute (2022). Consumer Price Index, October 2022. TurkStat Press Release.
8. Central Bank of the Republic of Turkey (2022). Inflation Report 2022-IV. CBRT.
9. Bezemer, D. J. (2009). No One Saw This Coming: Understanding Financial Crisis Through Accounting Models. MPRA Paper No. 15892. University Library of Munich.
10. Reinhart, C. M., & Rogoff, K. S. (2009). This Time Is Different: Eight Centuries of Financial Folly. Princeton University Press.
11. Bank for International Settlements (2021). Calibrating the Countercyclical Capital Buffer Using the Credit-to-GDP Gap: Cross-Country Evidence. BIS Working Papers No. 952.
12. Reserve Bank of Australia (2010). Australia's Experience in the Global Financial Crisis. RBA Bulletin, March Quarter 2010.