
This piece is the complete Chapter 17 of The Declaration of the Age of Physical Economics (Yoon Jong-won, Yoon So-ri, Yoon Jun). It is an academic account presenting the authors' physical economics hypothesis, and the body, figures, and citations follow the manuscript as written.
The Concept of the Underlying Condition
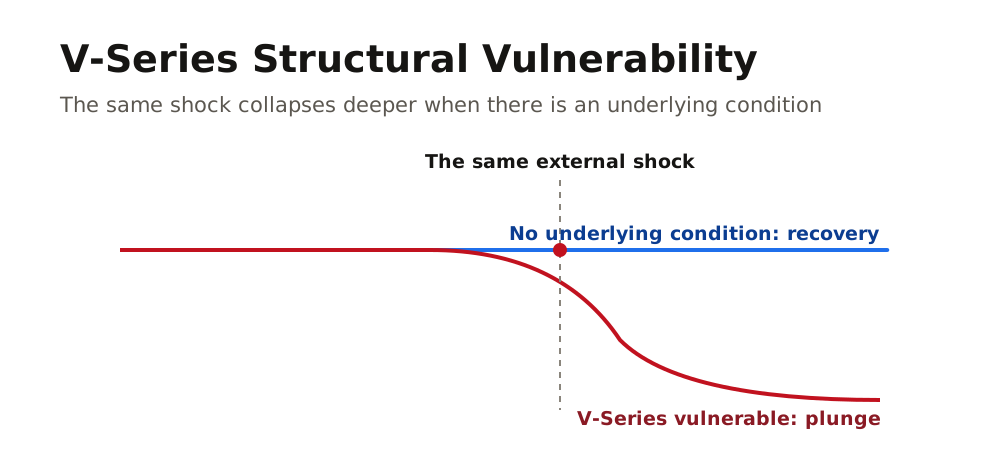
The V-Series is a tool for measuring the underlying conditions of the economy. Even when an external shock is of the same size, the outcome differs according to the economy's baseline state, and the V-Series quantifies this baseline state, that is, structural vulnerability. Just as in medicine a person with underlying conditions such as obesity, smoking, diabetes, or high blood pressure collapses more deeply from the same flu, in the economy too, when structural weakening such as a decline in the working-age population, income polarization, and a fall in the contribution of domestic demand has accumulated, a more severe blockade occurs from the same external shock.
The 2008 global financial crisis (GFC) was a natural experiment in which the same shock struck the United States, Korea, and Australia simultaneously. The United States fell hard, Korea was shaken to a middling degree, and Australia barely fell at all. If the size of the shock was the same yet the outcomes differed, that means the difference lay in each country's economic underlying conditions. In the United States, household debt had piled up to dangerous levels. The household debt service ratio had soared to 13.2%, so more than one seventh of household income was being drawn off into debt interest, and the savings rate had fallen to 2.6%, so the emergency vault was almost empty. Transposed to the human body, this corresponds to catching the flu while a large amount of calcification had been deposited on the walls of the blood vessels. Australia was in a relatively healthy state of household finances. It was hit by the same flu, but because it had no underlying condition, it recovered quickly.
The question the V-Series asks is not "has a crisis come now?" It asks "if a shock comes now, how deeply will it collapse?" Even if the economic indicators look sound, a high V-Series is a warning that the economy could fall deeply from a single small shock. It is the same principle by which, even if blood pressure is normal, it is dangerous when a large amount of calcification is confirmed on a coronary artery CT. The V in the name V-Series is the first letter of Vulnerability, and 9 gauges are deployed for Korea and 11 for the United States.
Where this tool differs from the blockade diagnosis is the point of measurement. If the blockade diagnosis operates every month and asks "is the flow blocked now?", the V-Series accumulates structural indicators that move slowly over spans of years and asks "how far is the preparation for blockage advanced?" The household debt service ratio does not double in a single month, but the way that ratio climbs from 10% to 13% over five years shows most honestly how far that society is being exposed to risk.
Underlying Conditions and Shock Absorption Capacity
| Category | Healthy Person (No Underlying Condition) | Person with an Underlying Condition |
|---|---|---|
| Catches the same flu | Recovers in 3 days | Hospitalized with pneumonia |
| Struck by the same financial crisis | V-shaped rebound (Australia, 2008) | Prolonged recession (United States, 2008) |
| What makes the difference | No obesity, diabetes, high blood pressure | Has obesity, diabetes, high blood pressure |
| V-Series measurement result | Low (high shock absorption capacity) | High (low shock absorption capacity) |
The 3 Classifications of V-Series Gauges
The V-Series deploys 9 gauges for Korea and 11 for the United States. The reason the same tool has a different number of gauges in the two countries is that the structural characteristics of the two economies differ. In the United States, the interest burden of household debt serves as a direct trigger of structural blockade, so the household debt service ratio was added as a separate gauge, and the interest burden of the federal government is also measured separately. In Korea, the demographic structure and the distribution of household disposable income are the key variables, so the measurement points there are deployed more thickly.
The gauges are divided into 3 classifications. These are the three corresponding respectively to the Deficiency (D), Inflammation (I), and Hypoxia (H) of the DIAH triggers: deficiency vulnerability (vulnD), inflammation vulnerability (vulnI), and hypoxia vulnerability (vulnH).
Deficiency vulnerability includes the growth rate of the working-age population and the current account balance as a ratio to GDP. The change in the population able to work is at once the most slowly moving and the most deeply acting structural indicator. A change of a 1% decline in a year is scarcely perceptible visibly, but once 10 years accumulate, the load required to maintain an economy of the same size increases by 10%. When the current account deficit grows, funds flow out to the outside and the total volume of circulation itself decreases. Transposed to the human body, this corresponds to a state in which the length of the blood vessels remains the same but the number of cells decreases, so flow efficiency falls. In Korea, the entry of the working-age population growth rate into -1.14% in 2025 is the first such record in the 351-month verification period. It means that the number of cells itself has begun to decrease, and this alone becomes a condition under which the economy could collapse more deeply from the same external shock than in 2008.
What inflammation vulnerability measures is the accumulated depth by which the interest burden narrows the consumption channel. When interest is drawn out of household disposable income, the amount drawn out narrows the consumption channel by that much, and when this narrowing accumulates, consumption begins to contract even before an external shock arrives. In Korea, the jeonse-to-price ratio, the Gini coefficient, and the growth rate of lower-tier income and consumption belong to this classification, and in the United States, the house-price-to-income ratio, the Gini coefficient, the income growth rate of the bottom 20%, and the household debt service ratio correspond to it. The reason the household debt service ratio was added as a separate gauge in the United States is that in the American economy the interest burden of household debt serves as a direct trigger of structural blockade. The soaring of the U.S. household debt service ratio to 13.2% in 2007 was a core part of the structural causes of the global financial crisis.
Hypoxia vulnerability captures how much oxygen is running short at the periphery of the economy. When the consumption power of households weakens and service-sector employment shrinks, the back-alley economy and small business owners are the first to begin collapsing from oxygen shortage. The real consumption growth rate, the savings rate (or the average propensity to consume), the service-sector employment growth rate, and the contribution of domestic demand fall into this classification, and in the United States, the ratio of federal interest payments to GDP is added, so that the degree of oxygen exhaustion at the government level is measured together. A high hypoxia vulnerability means that household consumption power, service-sector jobs, and the contribution of domestic demand are all weakened, and when an external shock comes in, necrosis begins from oxygen shortage starting at the periphery of the economy. The state in the United States in 2025, in which the ratio of federal interest payments to GDP approached the risk threshold at 3.2%, shows that the government's fiscal oxygen is being exhausted on interest payments, and it is also a signal that when an external shock strikes, the government's capacity to respond is reduced by that much.
Full Roster of V-Series Gauges (9 for Korea, 11 for the United States)
| Classification | Gauge | Bodily Meaning | Korea | United States |
|---|---|---|---|---|
| Deficiency (vulnD) | Working-age population growth rate | Decrease in cell count along the flow path | O | O |
| Deficiency (vulnD) | Current account balance to GDP | Volume of blood flowing out of the body | O | O |
| Inflammation (vulnI) | House-price-to-income ratio | Hidden calcification on vessel walls | O | O |
| Inflammation (vulnI) | Gini coefficient | Structural severance of the circulatory path | O | O |
| Inflammation (vulnI) | Lower-tier income and consumption growth rate | Speed of peripheral cell necrosis | O | O |
| Inflammation (vulnI) | Household debt service ratio | Thickness of microcalcification deposits | X | O |
| Hypoxia (vulnH) | Real consumption growth rate | Oxygen supply to the periphery | O | O |
| Hypoxia (vulnH) | Savings rate and propensity to consume | Remaining balance in the emergency vault (bone) | O | O |
| Hypoxia (vulnH) | Service-sector employment growth rate | Blood flow speed in the microvasculature | O | O |
| Hypoxia (vulnH) | Contribution of domestic demand | Share of biological circulation | O | O |
| Hypoxia (vulnH) | Federal interest payments to GDP | Calcification of the aorta | X | O |
A Tool That Responds Differently Depending on the Type of Crisis
The V-Series is not a tool that comes out high in every crisis. It is normal for it to come out high only in structural crises and to come out low in external shocks or natural disasters. "The V-Series was low but a crisis broke out" is not a failure of the V-Series but an accurate diagnosis that the crisis arose not from an underlying condition but from an external shock. When a healthy person with no underlying condition at all suffers a fracture in a traffic accident, the health checkup result coming out as "normal" is not a failure of the health checkup. It is because a traffic accident is an external event unrelated to underlying conditions.
There are 3 types of crisis. In a structural crisis, the V-Series comes out high. Since microcalcification (interest) has piled up inside the economy and income polarization has deepened so that the blood vessels are narrowed when a shock is applied, the V-Series accurately captures this internal weakening. The 2007 U.S. global financial crisis (GFC) is a representative case.
In an external debt crisis, the V-Series comes out low. Since the domestic structure was healthy but funds flowed out from the outside, the V-Series being low is the accurate verdict. The 1997 Korean foreign exchange crisis corresponds to this type. At that time, the external debt structure of a short-term external debt ratio of 58% and a surge in the current account deficit was the cause of the crisis.
In a natural disaster, it is normal for the V-Series not to detect it. Because a pandemic or a war is an external acute shock like a traffic accident, it lies outside the range of underlying conditions. When COVID struck in 2020, the V-Series being undetected in Korea is this type.
Interpretation of V-Series Responses by Crisis Type
| Crisis Type | V-Series Response | Interpretation |
|---|---|---|
| Structural crisis (internal + external) | High | The water rose while the embankment was low, so detection is normal |
| External debt crisis | Low | The domestic embankment was high but water overflowed from outside. Low is the accurate verdict |
| Natural disaster (pandemic, war) | Undetected | It is a traffic accident, so it is unrelated to underlying conditions. Undetected is the accurate verdict |
From this principle of interpretation, one more important implication follows. When a natural disaster strikes while the V-Series is high, it is like a patient with an underlying condition suffering a traffic accident. A person with no underlying condition only needs to treat the fracture, but a person with an underlying condition faces a far higher risk of complications during surgery. This is why, when COVID struck in 2020, Korea's V-Series was relatively low and a V-shaped rebound appeared. If a pandemic of the same size were to strike again in the state of structural vulnerability as of 2025 (an all-time high), a rapid recovery like that of 2020 would be hard to expect. It is because when an underlying condition and an external shock combine, the recovery time increases not by addition but by multiplication.
Historical Verification of Korea's V-Series
In verification spanning 351 months of Korea, the V-Series accurately identified all 4 crisis types.
The 1997 foreign exchange crisis. On November 21, 1997, the Korean government applied to the International Monetary Fund (IMF) for a bailout. It was the point at which foreign exchange reserves had fallen to 3.9 billion dollars. At the same point, the V-Series came out as low. At that time, Korea's domestic structure was relatively healthy. The working-age population growth rate was sound at +0.72% and the Gini coefficient was also low at 0.298. Since the cause of the crisis lay not in a domestic underlying condition but in the external debt structure of a short-term external debt ratio of 58% and a surge in the current account deficit, the V-Series being low was an accurate verdict.
The 2008 global financial crisis. On September 15, 2008, America's Lehman Brothers filed for bankruptcy, and global capital flows came to a halt. Korea was struck by the same shock, and the V-Series came out as middling. The Gini coefficient had begun to rise to 0.340, a figure at which the gap between the upper and lower income tiers had widened and the path of fund circulation had begun to narrow. Real consumption and service-sector employment fell simultaneously, but the working-age population still maintained +0.35%. It was the result of the V-Series accurately identifying, as middling, a state in which structural vulnerability and an external shock acted together.
The 2020 COVID. On March 11, 2020, the World Health Organization (WHO) declared a COVID pandemic. The V-Series was undetected. Since a pandemic is an external acute shock like a traffic accident, it is normal for an underlying-condition measurement tool not to detect it, and the very fact that Korea succeeded in a V-shaped rebound supports the health of its baseline structure.
The present, 2025. Korea's V-Series is recording an all-time high level of structural vulnerability. The most serious indicator is the working-age population growth rate. It has entered a declining trend at -1.14%, the first such record in the 351-month verification period. The fact that this figure, which was +0.72% in 1997 and +0.35% in 2008, has turned negative means that the number of cells of the economy itself has begun to decrease. The Gini coefficient has risen to 0.399, so the structural severance of the circulatory path is deepening, and the contribution of domestic demand is at 0.6%p, so the shrinkage of the consumption base due to population decline is becoming visible. The reason a far deeper blockade is expected if an external shock of the same size comes in 2025 than when it came in 2008 lies in these figures.
Historical Verification of Korea's V-Series in 4 Cases (All 4 Accurate)
| Point in Time | Crisis Type | V-Series | Basis |
|---|---|---|---|
| 1997 IMF foreign exchange crisis | External debt crisis | Low | Working-age population growth rate +0.72%, Gini coefficient 0.298. Domestic structure healthy. External capital outflow was the cause |
| 2008 GFC | Structural + external | Middling | Gini coefficient rose to 0.340, real consumption and service-sector employment fell simultaneously, working-age population maintained +0.35%. Dual cause |
| 2020 COVID | Natural disaster | Undetected | External acute shock, unrelated to underlying conditions. Health of baseline structure confirmed by V-shaped rebound |
| The present, 2025 | Structural deterioration | All-time high | Working-age population -1.14%, Gini coefficient 0.399, contribution of domestic demand 0.6%p. Deeper damage than 2008 expected under the same shock |
Historical Verification of the U.S. V-Series
In verification of 339 months of the United States as well, the V-Series accurately identified all 4 crisis types.
The 2000 dot-com bubble. In March 2000, the Nasdaq began its decline from a peak of 5,048.62, and by October 2002 it had plunged about 78%. In that same period, the V-Series came out as low. The working-age population was abundant at +1.2% and the Gini coefficient was also 0.40, a state in which the circulatory path had not yet been severed. It is because the bubble was in asset prices and not in the channels of the real economy. The V-Series being low was an accurate verdict.
The 2007 GFC. In June 2007, 2 hedge funds under Bear Stearns went bankrupt, on August 9, 2007, BNP Paribas suspended redemptions of 3 asset-backed securities funds, on March 16, 2008, the sale of Bear Stearns to JPMorgan Chase at 2 dollars per share was announced, and on September 15, 2008, Lehman Brothers filed for bankruptcy. At the point just before the crisis fully broke out, the V-Series was high. The household debt service ratio had soared to 13.2%, a state in which households could not physically breathe under the burden of interest (microcalcification). At the same time, the savings rate had fallen to 2.6%, so the emergency vault (bone) was almost exhausted. The house-price-to-income ratio was 5.1 times, a figure at which hidden calcification deposits had reached their maximum. The structural fissures were already deep before the external shock, and the V-Series accurately captured this.
Just before the 2019 COVID. The V-Series came out as very low. The household debt service ratio had fallen to 9.7%, the lowest household debt burden in a generation, and the savings rate had also recovered to 7.5%. It was the structurally healthiest period, and the non-detection of COVID-19 in March 2020 was normal. The fact that the 2.2 trillion dollar COVID response act (CARES Act), which the U.S. government passed on March 27, 2020, was rapidly absorbed when it reached households directly was also possible on top of this clean structure.
The present, 2025. The U.S. V-Series is likewise at an all-time high level. The house-price-to-income ratio of 5.0 times has approached the 5.1 times just before the 2006 global financial crisis. The Gini coefficient of 0.49 is the highest level among OECD countries. The ratio of federal interest payments to GDP of 3.2% is approaching the risk threshold. The household debt service ratio of 11.3% is in a state that leaves only about 2%p of margin from the 13.2% just before the global financial crisis.
Historical Verification of the U.S. V-Series in 4 Cases (All 4 Accurate)
| Point in Time | Crisis Type | V-Series | Basis |
|---|---|---|---|
| 2000 dot-com bubble | Market overheating | Low | Working-age population +1.2%, Gini coefficient 0.40. Real channels healthy. Only an asset bubble existed |
| 2007 GFC | Structural + external | High | Household debt service ratio 13.2% (severe), house-price-to-income ratio 5.1 times (severe), savings rate 2.6% (severe) |
| Just before 2019 COVID | Structurally healthy | Very low | Household debt service ratio 9.7% (mild), savings rate 7.5% (mild). Healthiest in a generation |
| The present, 2025 | Structural rigidity | All-time high | House-price-to-income ratio 5.0 times (severe), Gini coefficient 0.49 (severe), federal interest/GDP 3.2% (near severe) |
In 2025, If the Same Shock Strikes
Placing the current 2025 states of the two countries side by side reveals the fact that the V-Series is recording an all-time high level of structural vulnerability in both. The vulnerabilities of the two countries are described with the same word, but their kinds differ. Korea is a silent weakening based on population. The working-age population has turned to a declining trend (-1.14%), the Gini coefficient has risen to 0.399, and the contribution of domestic demand has shrunk to 0.6%p. The change in which the number of people able to work itself decreases is settled most deeply.
The United States is the accumulated pressure of debt accumulation. House prices have again reached 5 times income, the Gini coefficient has risen to the highest level in the OECD, and federal interest payments are taking away 3.2% of GDP. It is a state in which households and the government have simultaneously become short of breath under the interest burden. Unlike in 2007, it is not the hemorrhagic type in which a pipe suddenly bursts, but the arteriosclerotic type of vulnerability in which the pipe itself gradually hardens.
The two vulnerabilities converge on the same result in the face of an external shock. Had an external shock of the same size come in 2019, the U.S. economy would have absorbed it relatively easily. If the same shock comes to the current structure of 2025, far deeper damage is expected. In Korea too, it is hard to expect that the V-shaped rebound of the time of the 2020 COVID will be reproduced this time. It is the same principle by which a patient with an underlying condition needs hospitalization even from the same flu.
The place that captures this change is the V-Series. If the blockade diagnosis is a tool that asks "is the flow blocked now?" every month, the V-Series asks "how far is the preparation for blockage advanced?" over spans of years. The two tools differ in the time they ask about, differ in the question they ask, and differ in the way they produce an answer. If the blockade diagnosis is the emergency-room monitor, the V-Series is the result sheet of the health checkup received every year. The reason one tool cannot replace the other is the same as one patient needing both an emergency-room monitor and a health checkup result sheet.
Measured Values of the 11 U.S. V-Series Gauges in 2025
| Classification | Gauge | Measured Value | Severity | Bodily Analogy |
|---|---|---|---|---|
| Deficiency (vulnD) | Working-age population growth rate | +0.2% | Middling | Decrease in cell count under way |
| Deficiency (vulnD) | Current account balance to GDP | -3.7% | Middling | Blood flowing out of the body |
| Inflammation (vulnI) | House-price-to-income ratio | 5.0 times | Severe | Hidden calcification deposits at maximum |
| Inflammation (vulnI) | Gini coefficient | 0.49 | Severe | Structural severance of the circulatory path |
| Inflammation (vulnI) | Income growth rate of the bottom 20% | +0.8% | Mild | Survival of peripheral cells |
| Inflammation (vulnI) | Household debt service ratio | 11.3% | Middling | Microcalcification deposits under way |
| Hypoxia (vulnH) | Real consumption growth rate | +2.0% | Mild | Oxygen supply maintained |
| Hypoxia (vulnH) | Savings rate | 3.6% | Middling | Emergency vault (bone) thinning |
| Hypoxia (vulnH) | Service-sector employment growth rate | +1.2% | Mild | Blood flow in the microvasculature maintained |
| Hypoxia (vulnH) | Contribution of domestic demand | +1.3%p | Mild | Biological circulation maintained |
| Hypoxia (vulnH) | Federal interest payments to GDP | 3.2% | Middling | Calcification of the aorta under way |
References
1. BNP Paribas Investment Partners (2007). BNP Paribas Investment Partners temporarily suspends the calculation of the Net Asset Value of the following funds: Parvest Dynamic ABS, BNP Paribas ABS Euribor and BNP Paribas ABS Eonia. Press release, August 9.
2. Drehmann, M., & Juselius, M. (2013). Evaluating Early Warning Indicators of Banking Crises: Satisfying Policy Requirements. BIS Working Papers No. 421.
3. International Monetary Fund (1997). IMF Approves SDR 15.5 Billion Stand-by Credit for Korea. IMF Press Release No. 97/55, December 4.
4. JPMorgan Chase & Co. (2008). JPMorgan Chase To Acquire Bear Stearns. Press release, March 16. (SEC Form 425).
5. Lehman Brothers Holdings Inc. (2008). Lehman Brothers Holdings Inc. Announces It Intends to File Chapter 11 Bankruptcy Petition. Press release, September 15.
6. National Bureau of Economic Research (2010). US Business Cycle Expansions and Contractions. NBER.
7. US Congress (2020). Coronavirus Aid, Relief, and Economic Security Act (CARES Act). Public Law 116-136, March 27.
8. World Health Organization (2020). WHO Director-General's opening remarks at the media briefing on COVID-19: 11 March 2020.